
Visualization
When introducing the concept of composite scores in presentations, it can be really helpful to visualize how a composite score is built up.
My personal preference is to use pie charts for this (despite the obvious limitations of these charts).
julia
using RheumaComposites
using Unitful
using CairoMakie

function components_pie(x::ContinuousComposite)
    fig = Figure()
    ax = Axis(
        fig[1, 1], title=string(typeof(x)),
        aspect=1, titlesize=36, titlefont=:bold
    )

    ratios = RheumaComposites.decompose(x)
    colors = first(Makie.wong_colors(), length(ratios))

    nt = NamedTuple{names(x)}(values(x))
    labels = ["$var=$(getindex(nt, var))" for var in keys(ratios)]

    ncats = length(ratios)
    nδ = 1 / ncats

    pie!(
        ax, collect(values(ratios));
        color=colors, radius=4, inner_radius=2,
        strokecolor=:white, strokewidth=5,
    )

    hidedecorations!(ax)
    hidespines!(ax)

    colormap = cgrad(colors, categorical=true)
    cbar = Colorbar(
        fig[2, 1]; colormap, flipaxis=false,
        vertical=false, spinewidth=0.0, ticksvisible=false
    )

    tickspacing = range(0 + nδ / 2, 1 - nδ / 2, ncats)
    cbar.ticks = (tickspacing, uppercase.(labels))

    text!(
        ax, string(round(score(x), digits=1)),
        align=(:center, :center), font=:bold, fontsize=42
    )

    return fig
end

sdai = SDAI(tjc=4, sjc=3, pga=48u"mm", ega=31u"mm", crp=6u"mg/dL")

components_pie(sdai)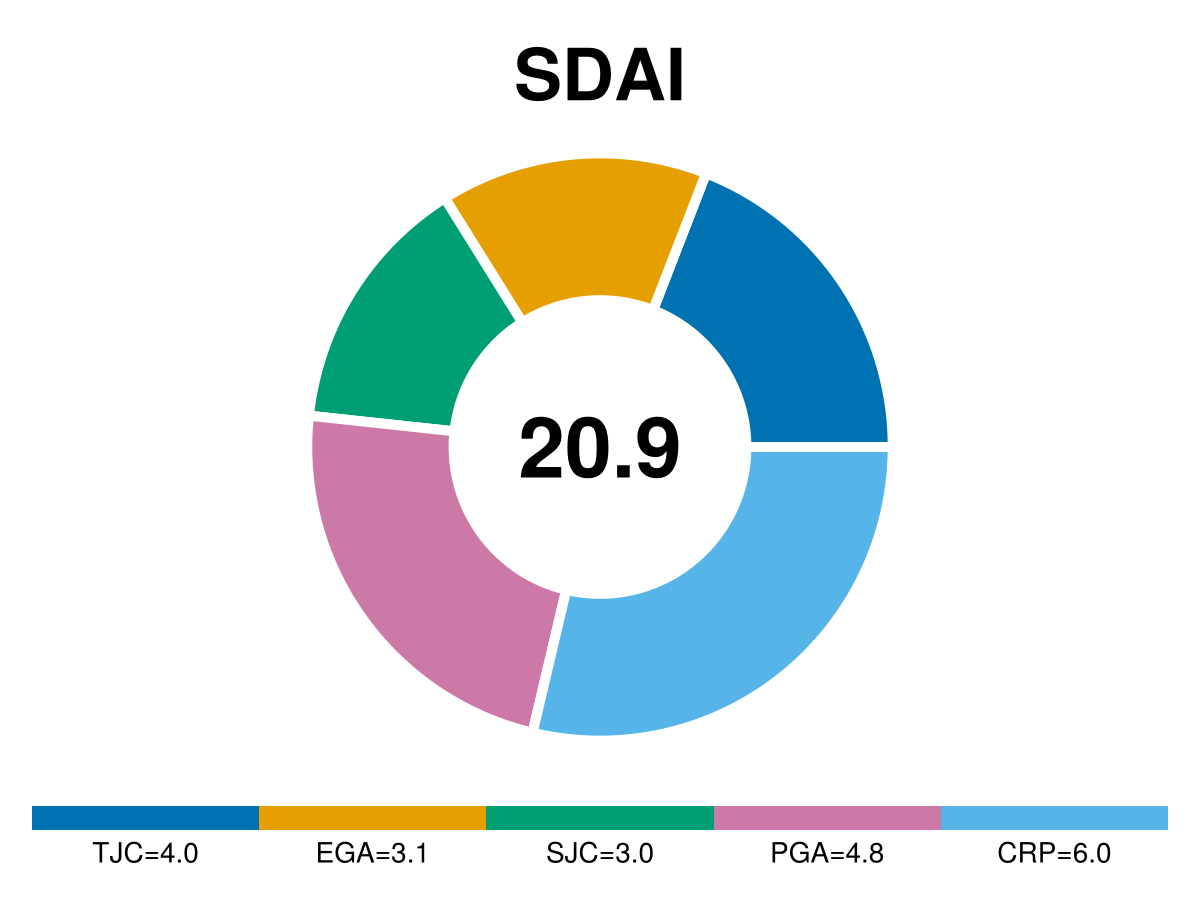
This page was generated using Literate.jl.