ChainsMakie
ChainsMakie implements several plotting methods and recipes for visualizing Markov chain Monte Carlo (MCMC) chains in Makie. Each plot type highlights a different aspect of the MCMC sampling, helping to diagnose potential problems.
The man entry point to the package is the plot method for a Chains object.
Quick start
Here's how to create the most common visual summary of MCMC chains:
julia
using ChainsMakie, CairoMakie
import MCMCChains: Chains
chains = Chains(randn(300, 3, 4), [:A, :B, :C])
plot(chains)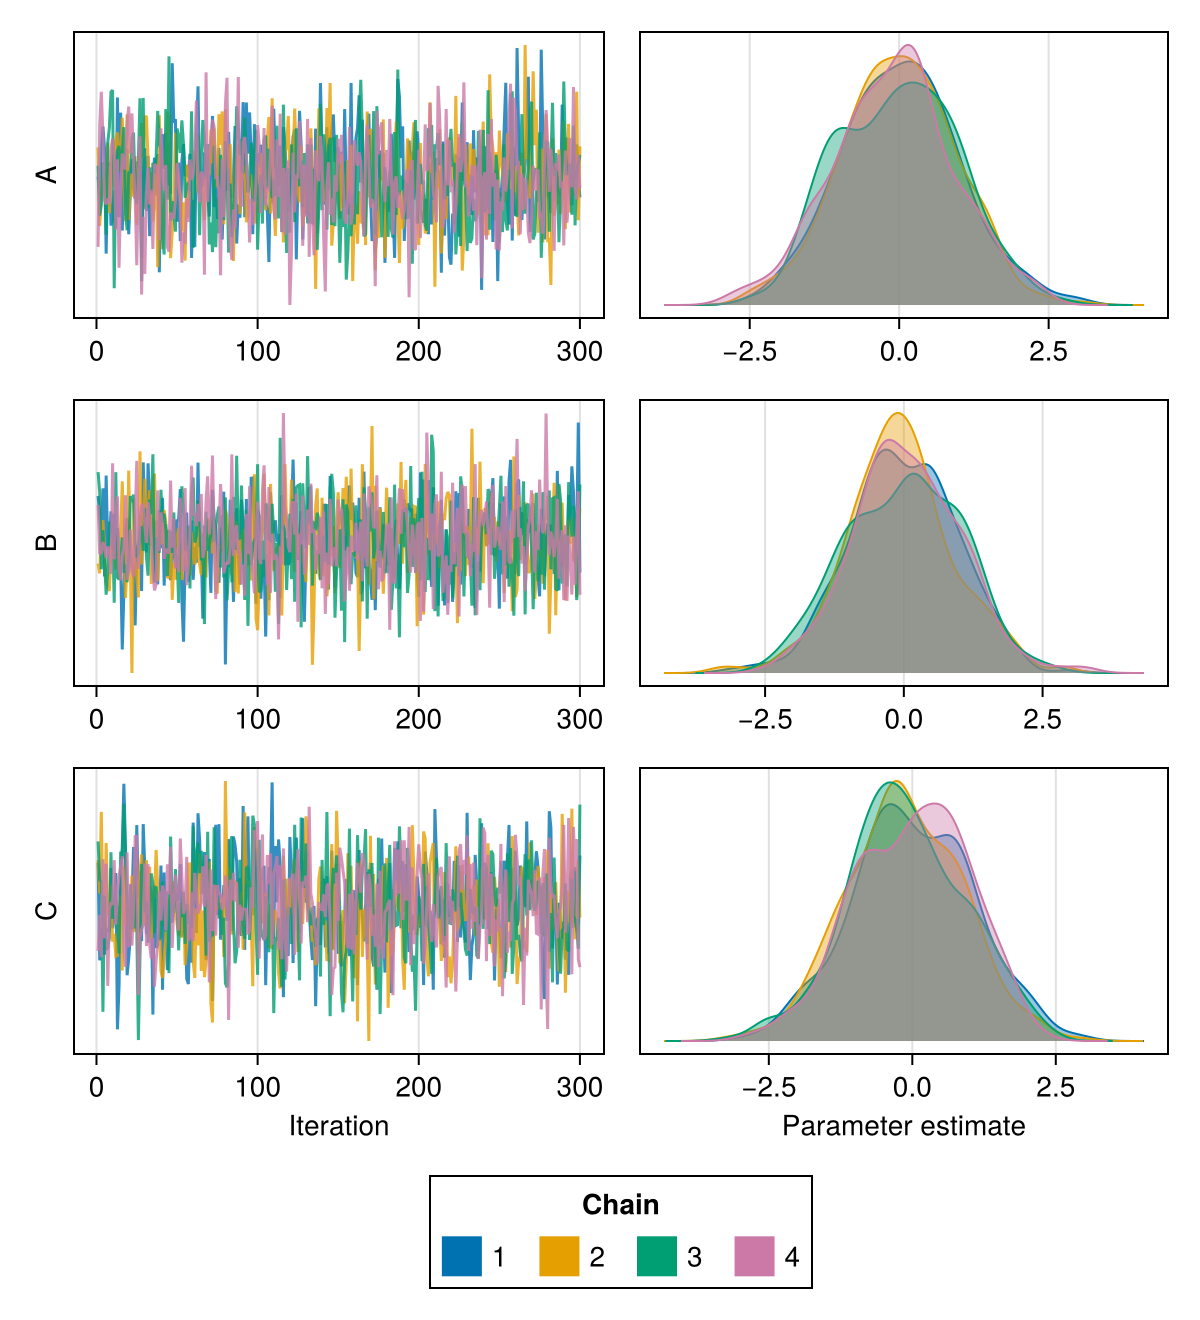
If the model parameters are in a similar range, you might prefer linking the x-axes to give it an even cleaner look:
julia
using ChainsMakie, CairoMakie
import MCMCChains: Chains
chains = Chains(randn(300, 3, 4), [:A, :B, :C])
plot(chains; link_x = true)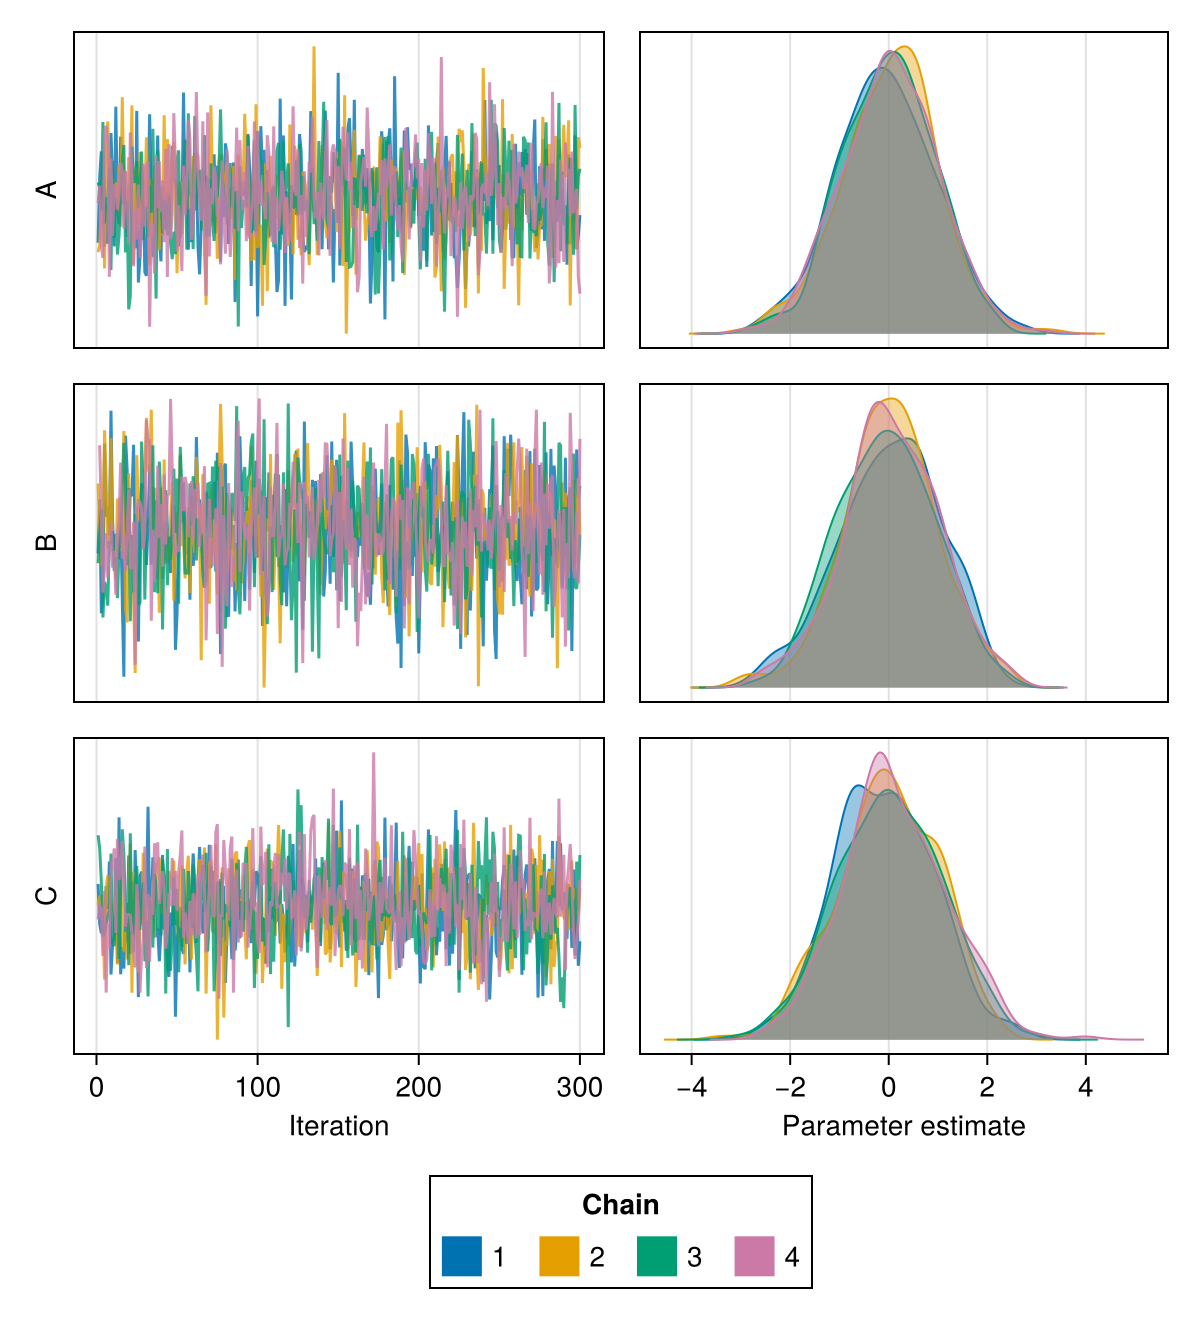
For all plotting functions exported by ChainsMakie, it is possible to plot a subset of the parameters by passing the parameter names to be plotted as the second argument to the plotting function:
julia
using ChainsMakie, CairoMakie
import MCMCChains: Chains
chains = Chains(randn(300, 3, 4), [:A, :B, :C])
plot(chains, [:A, :B])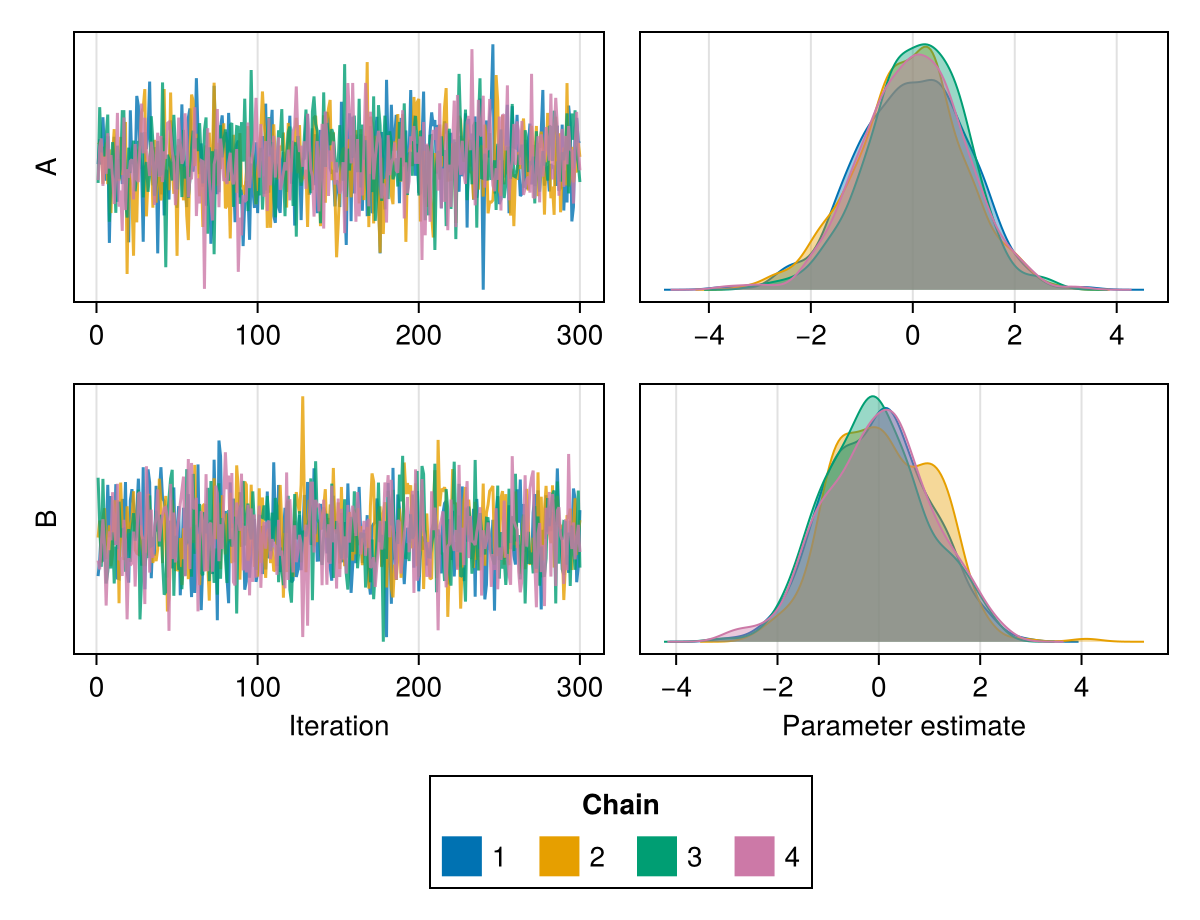
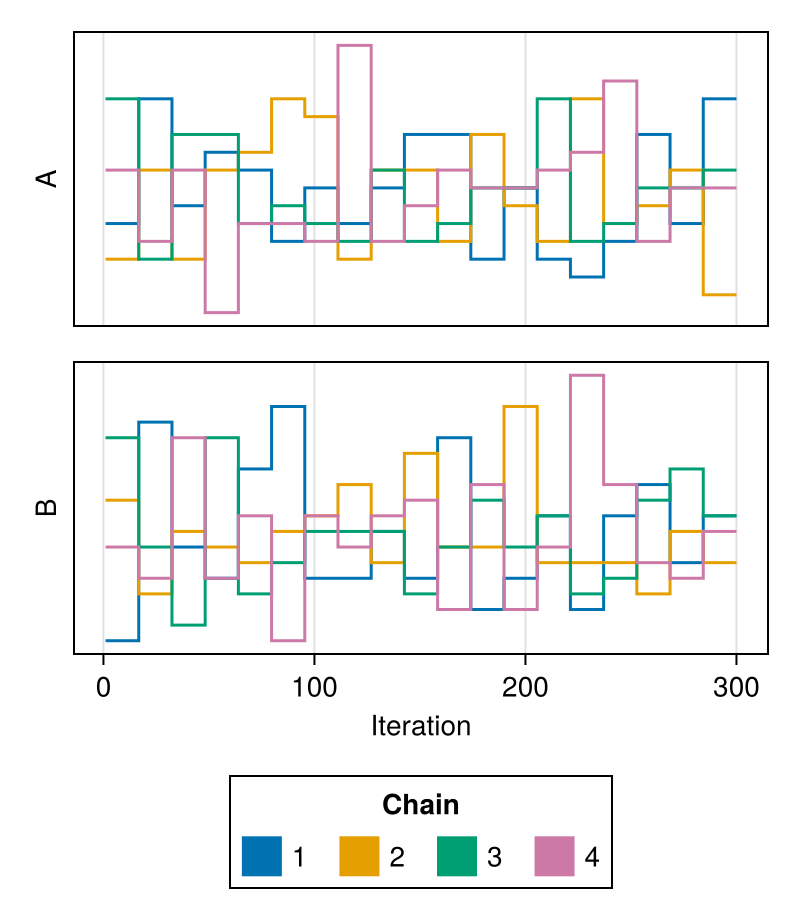
julia
using ChainsMakie, CairoMakie
import MCMCChains: Chains
chains = Chains(randn(300, 3, 4), [:A, :B, :C])
trankplot(chains, [:A, :B])