autocorplot
The autocorplot shows the autocorrelation of MCMC samples at different lags.
The autocorrelation of MCMC samples contains information about the efficiency of the sampling algorithm. Uncorrelated samples at short lags indicate efficient sampling, while high autocorrelations typically indicate problems in the exploration of the target distribution.
using ChainsMakie, CairoMakie
import MCMCChains: Chains
chains = Chains(randn(300, 2, 4), [:A, :B])
autocorplot(chains)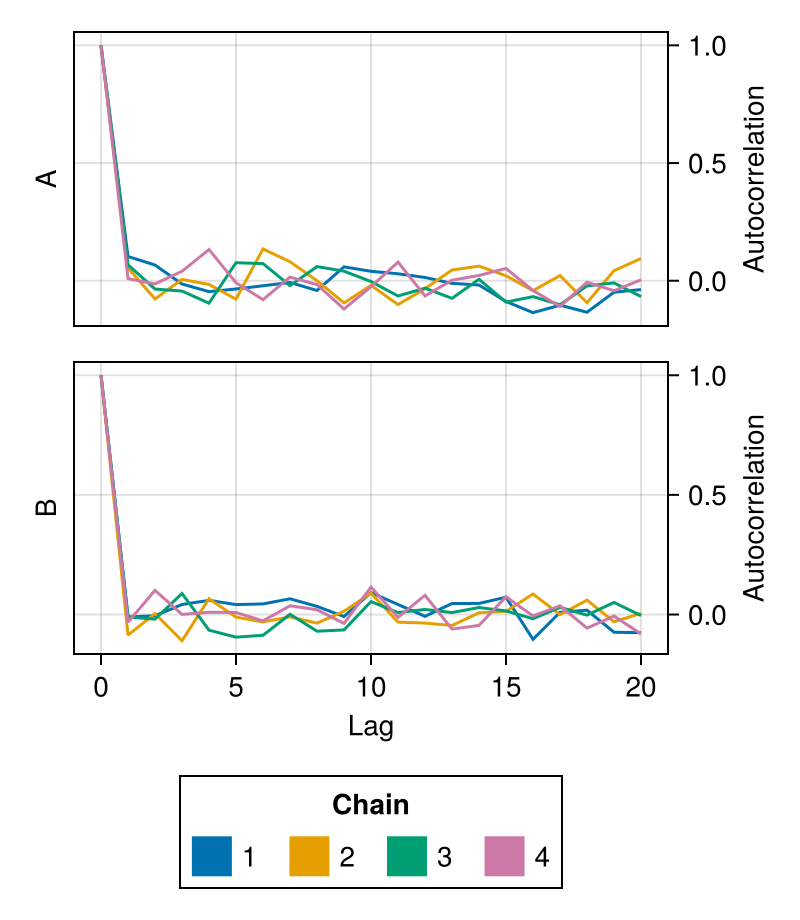
It is possible to plot a subset of the parameters by passing their names as the second argument:
using ChainsMakie, CairoMakie
import MCMCChains: Chains
chains = Chains(randn(300, 3, 4), [:A, :B, :C])
autocorplot(chains, [:A, :B])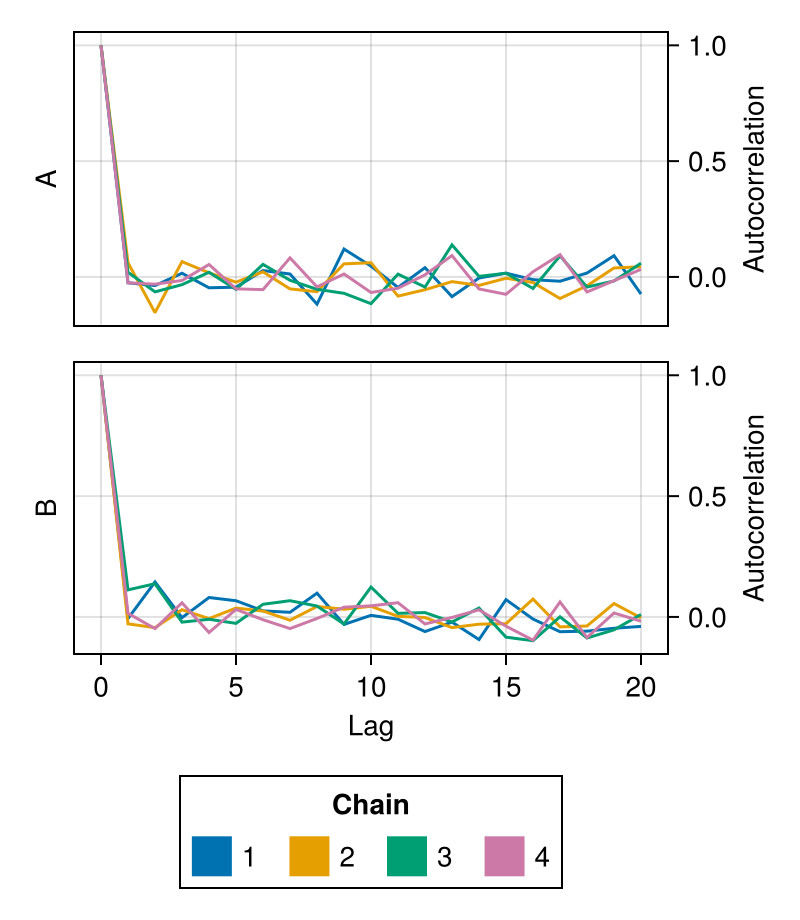
Attributes
lags
Controls at which lags the autocorrelation will be calculated.
Defaults to 0:20.
using ChainsMakie, CairoMakie
import MCMCChains: Chains
chains = Chains(randn(300, 2, 4), [:A, :B])
fig = autocorplot(chains; lags = 0:5:100)
fig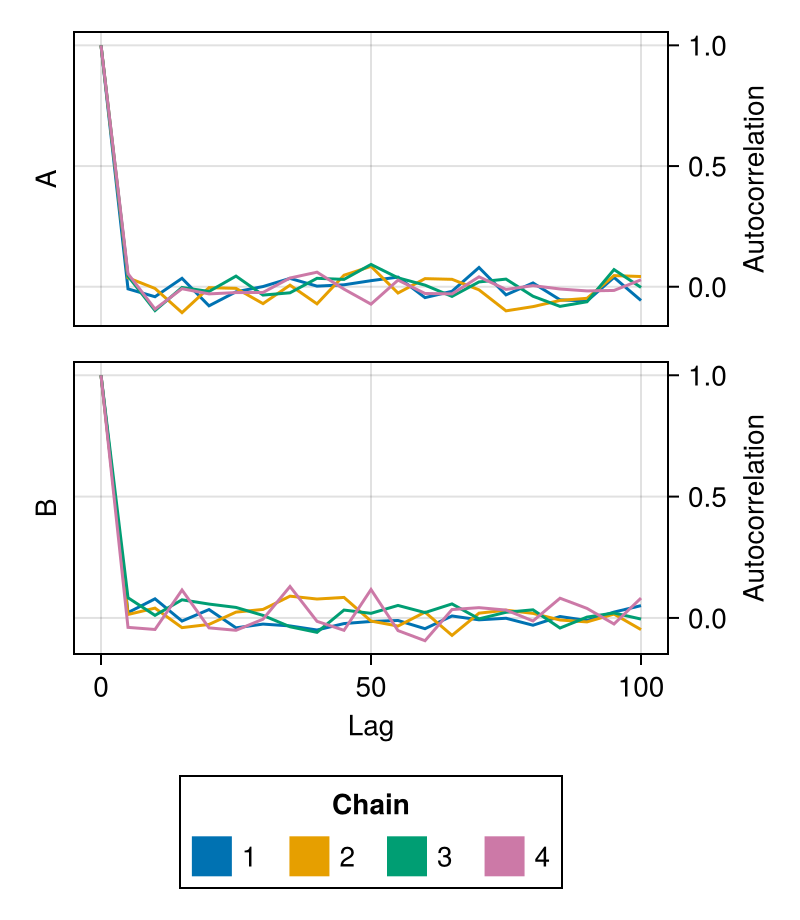
color
Controls which colors will be used to color the samples from each chain.
Defaults to Makie's wong_colors palette and automatically switches to colormap = :viridis for more than seven chains.
using ChainsMakie, CairoMakie
import MCMCChains: Chains
chains = Chains(randn(300, 2, 4), [:A, :B])
fig = autocorplot(chains; color = first(Makie.to_colormap(:tab20), 4))
fig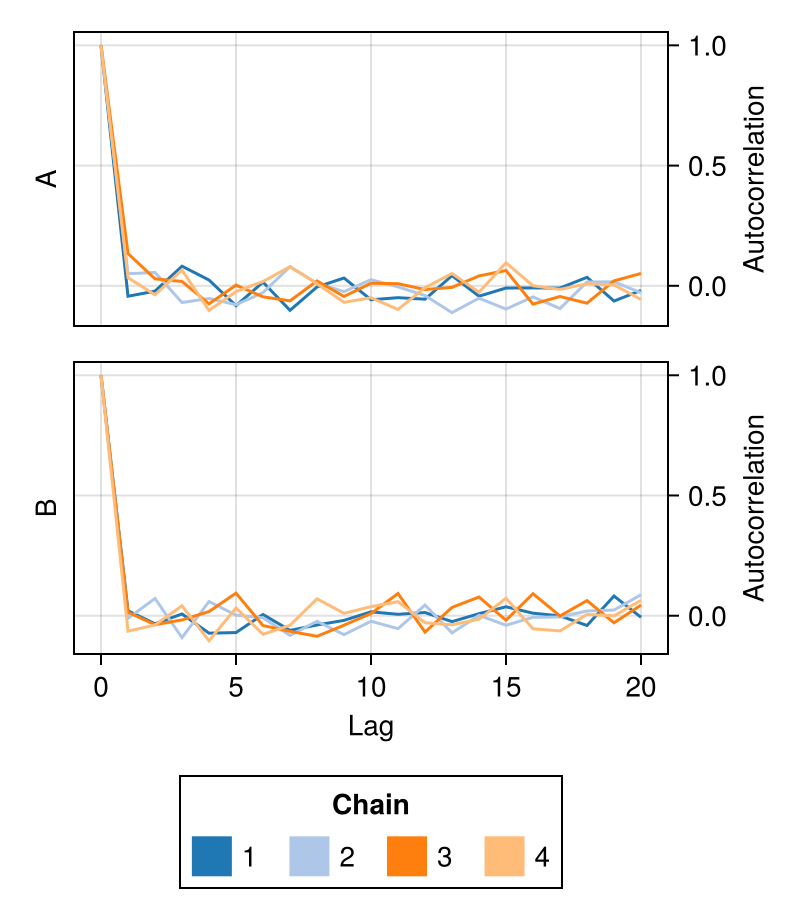
colormap
Controls which colormap will be used to color the samples from each chain.
Defaults to the :viridis palette.
using ChainsMakie, CairoMakie
import MCMCChains: Chains
chains = Chains(randn(300, 2, 4), [:A, :B])
fig = autocorplot(chains; colormap = :plasma)
fig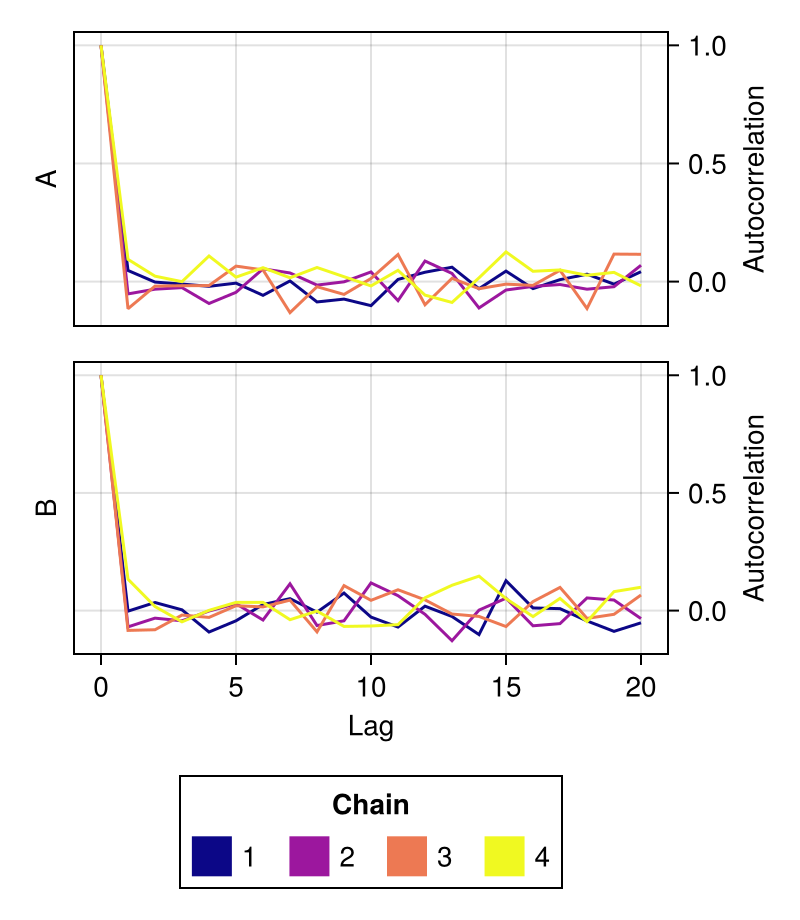
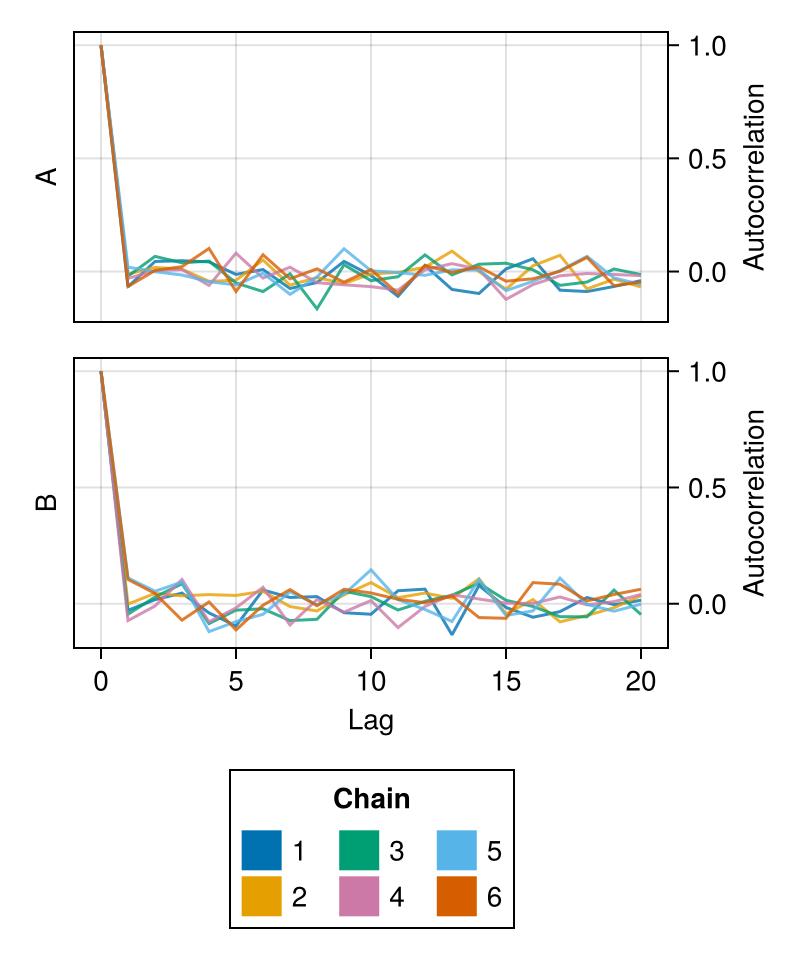
linewidth
Controls the linewidth of the autocorrelation plot of each chain.
Defaults to 1.5.
using ChainsMakie, CairoMakie
import MCMCChains: Chains
chains = Chains(randn(300, 2, 6), [:A, :B])
fig = autocorplot(chains; linewidth = 1.0)
fig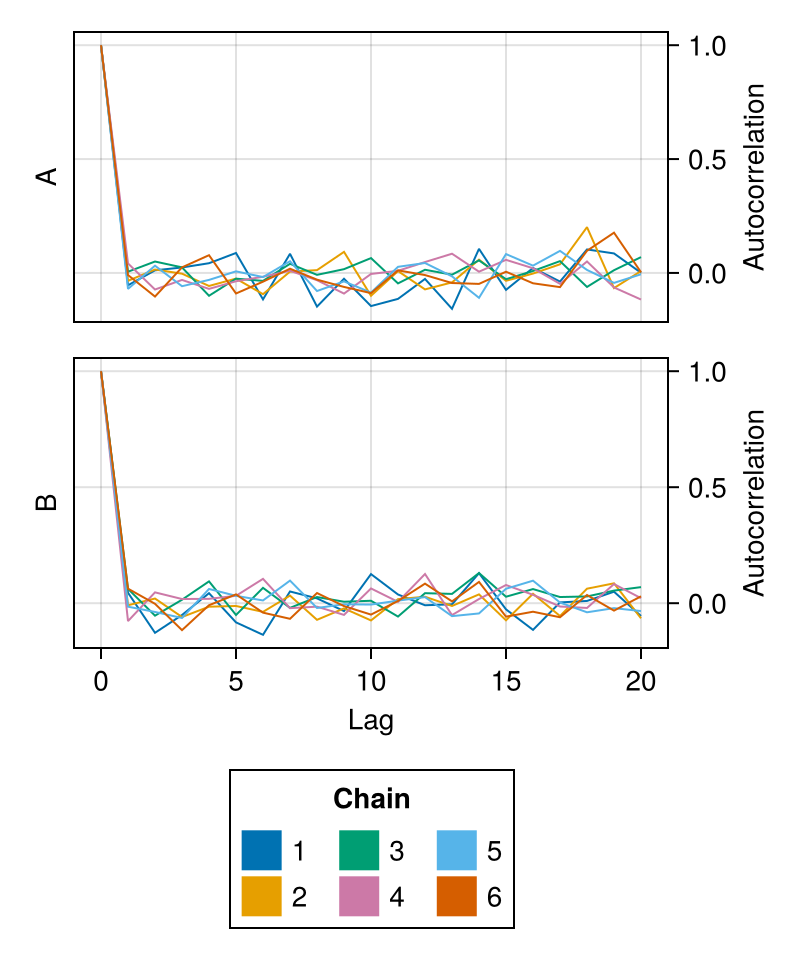
alpha
Controls the opacity of the autocorrelation plot of each chain.
Defaults to 1.0.
using ChainsMakie, CairoMakie
import MCMCChains: Chains
chains = Chains(randn(300, 2, 6), [:A, :B])
fig = autocorplot(chains; alpha = 0.8)
fig