forestplot
A forestplot of Chains displays point summaries of all samples per parameter with horizontal lines representing one or more credible intervals.
Forest plots allow for easy comparison of posterior distributions across multiple parameters. This, forest plots are better suited for reporting and interpretation than diagnosing issues in MCMC sampling because they collapse samples across chains.
using ChainsMakie, CairoMakie
import MCMCChains: Chains
chains = Chains(randn(300, 2, 4), [:A, :B])
fig, ax, plt = forestplot(chains)
fig
It is possible to plot a subset of the parameters by passing their names as the second argument:
using ChainsMakie, CairoMakie
import MCMCChains: Chains
chains = Chains(randn(300, 3, 4), [:A, :B, :C])
forestplot(chains, [:A, :B])
(Scene(2 children, 0 plots), Axis (1 plots), Plot{ChainsMakie.forestplot, Tuple{Vector{Base.ReshapedArray{Float64, 1, AxisArrays.AxisMatrix{Float64, Matrix{Float64}, Tuple{AxisArrays.Axis{:iter, StepRange{Int64, Int64}}, AxisArrays.Axis{:chain, UnitRange{Int64}}}}, Tuple{}}}}})Attributes
ci
You can choose which credible intervals should be plotted by passing a custom vector of values between 0 and 1. The proportion outside the ci will be distributed equally on the lower and upper tails of the summarised distribution.
Defaults to [0.95, 0.90].
using ChainsMakie, CairoMakie
import MCMCChains: Chains
chains = Chains(randn(300, 2, 4), [:A, :B])
fig, ax, plt = forestplot(chains; ci = [0.99, 0.95, 0.89])
fig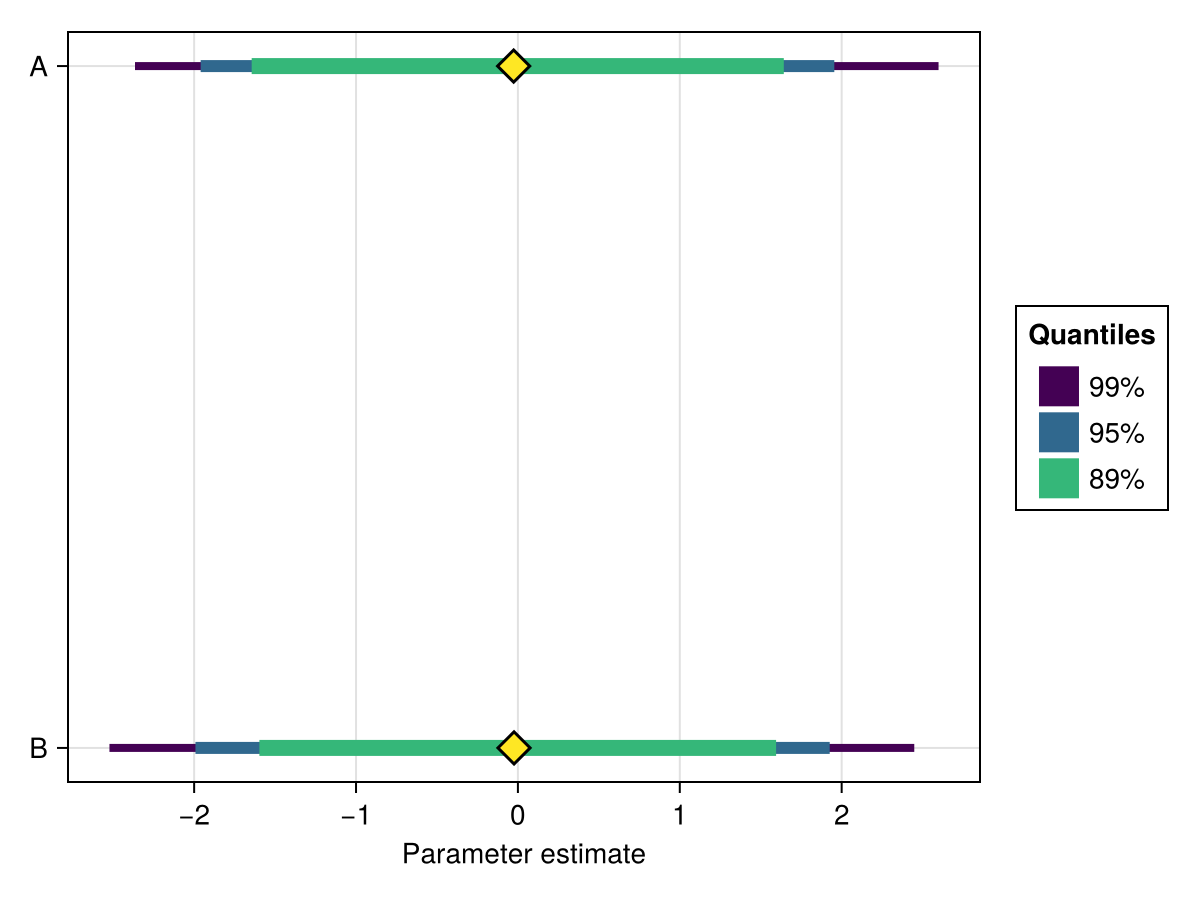
point_summary
Controls which function will be used to calculate the point_summary. Any function can be used so long as it returns a single Real number when applied to a vector Reals.
Defaults to median.
using ChainsMakie, CairoMakie
import StatsBase: mean
import MCMCChains: Chains
chains = Chains(randn(300, 2, 4), [:A, :B])
fig, ax, plt = forestplot(chains; point_summary = mean)
fig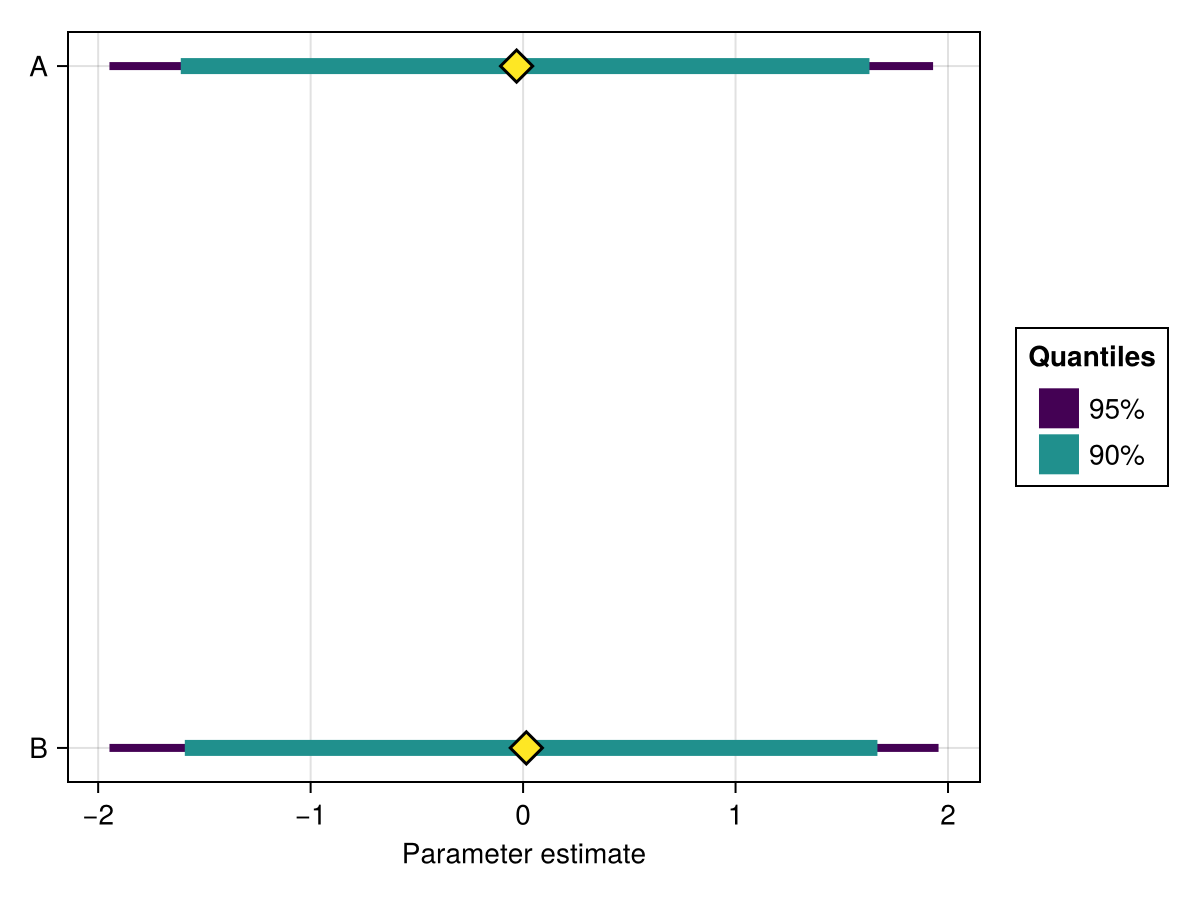
colormap
Specifies the colormap to be used for coloring the different quantiles.
Defaults to :viridis.
using ChainsMakie, CairoMakie
import MCMCChains: Chains
chains = Chains(randn(300, 2, 4), [:A, :B])
fig, ax, plt = forestplot(chains; colormap = :plasma)
fig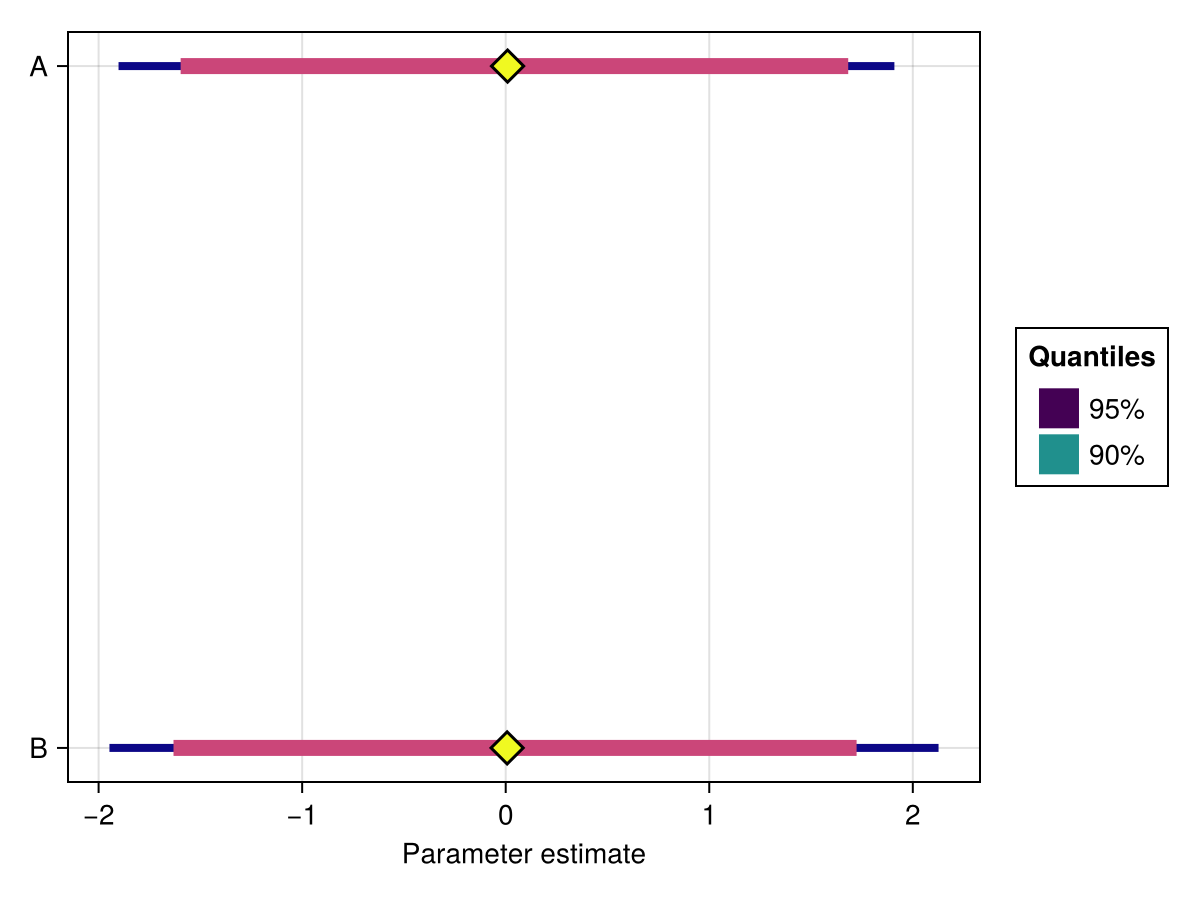
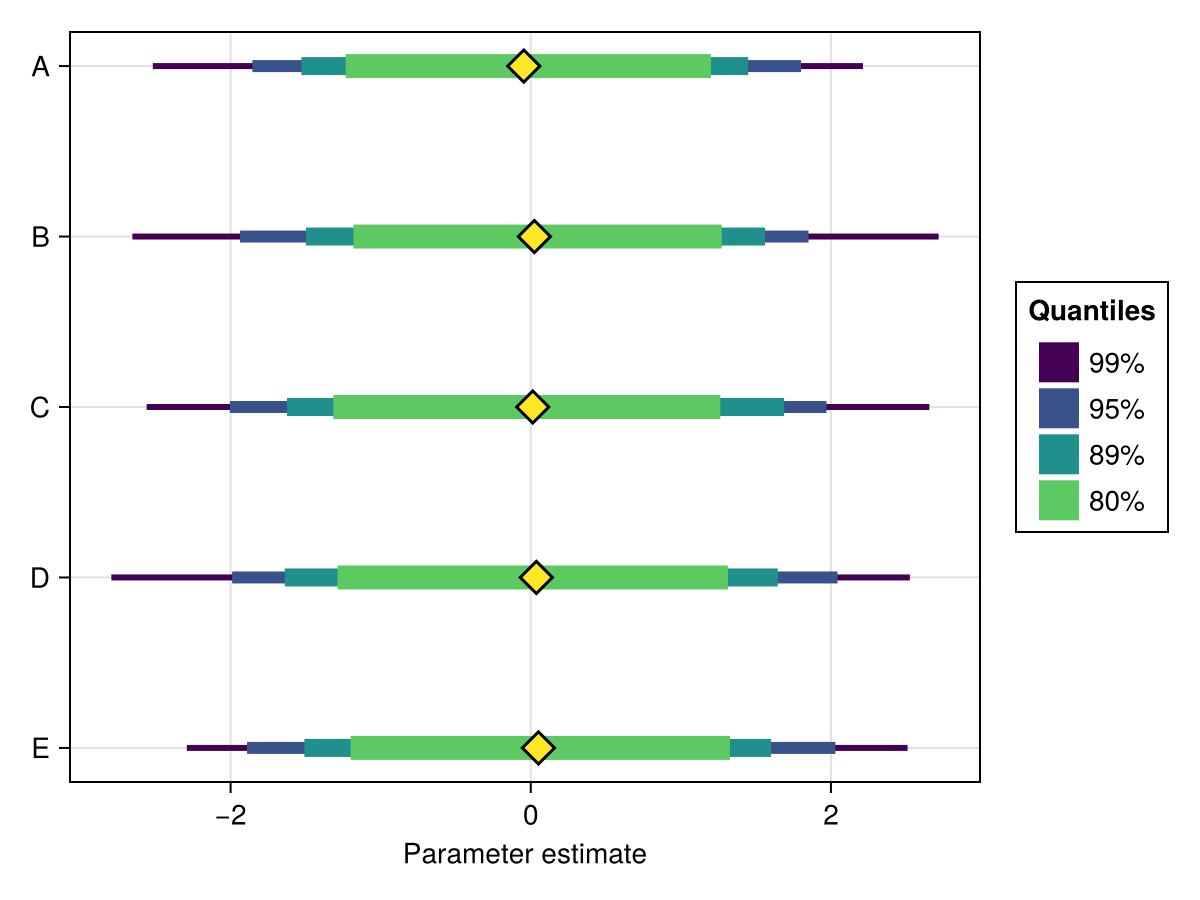
min_width
Controls the linewidth of the narrowest interval.
Defaults to 4.
max_width
Controls the linewidth of the widest interval.
Defaults to 8.
using ChainsMakie, CairoMakie
import MCMCChains: Chains
chains = Chains(randn(300, 5, 4), [:A, :B, :C, :D, :E])
ci = [0.99, 0.95, 0.89, 0.8]
fig, ax, plt = forestplot(chains; ci, min_width = 3, max_width = 12)
fig