density
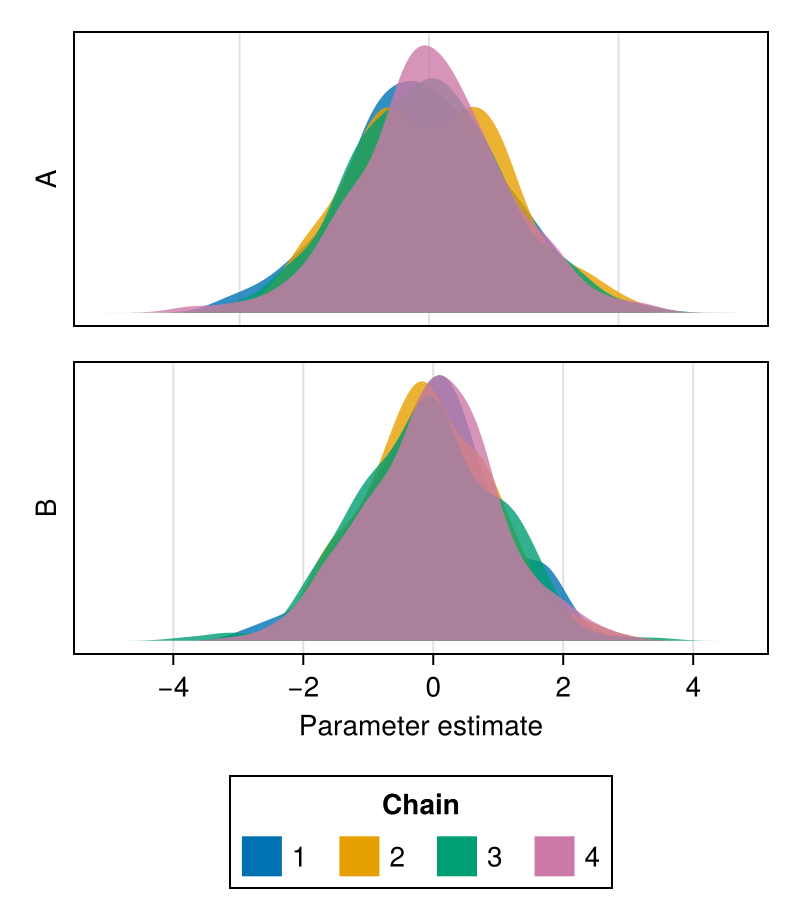
A density plot of Chains shows the kernel density estimate of the samples in each chain.
Density plots are a useful summary of both the shapes of distributions for each chain, and their location, highlighting potential convergence issues. Together with traceplots, they a part of the most common summary visualization of MCMC chains (see plot).
using ChainsMakie, CairoMakie
import MCMCChains: Chains
chains = Chains(randn(300, 2, 4), [:A, :B])
fig = density(chains)
fig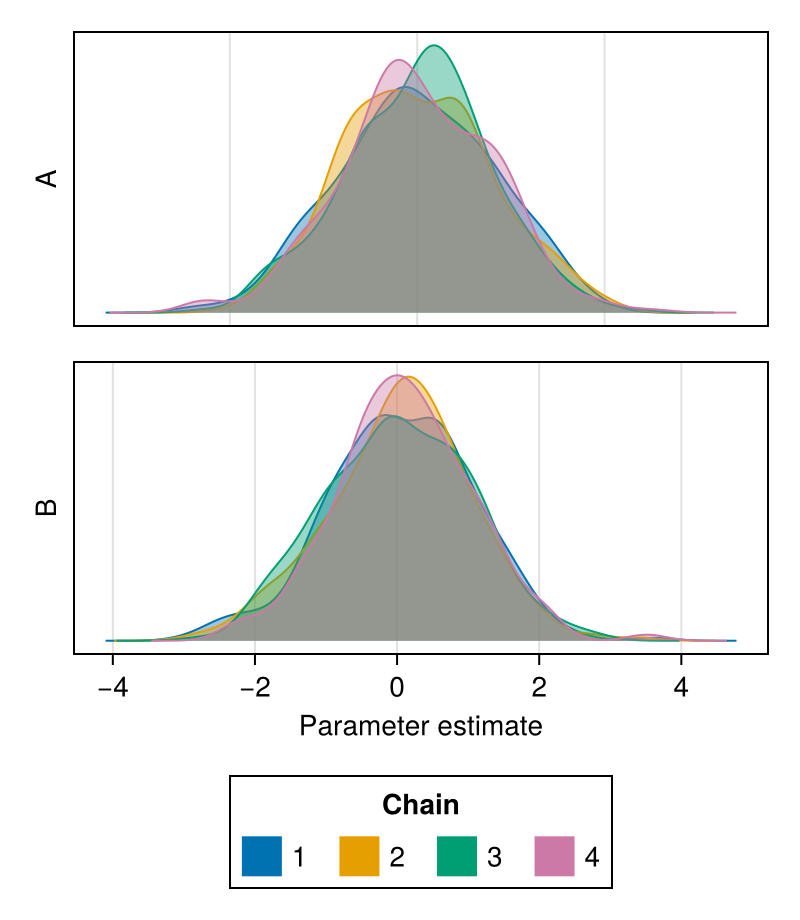
It is possible to plot a subset of the parameters by passing their names as the second argument:
using ChainsMakie, CairoMakie
import MCMCChains: Chains
chains = Chains(randn(300, 3, 4), [:A, :B, :C])
density(chains, [:A, :B])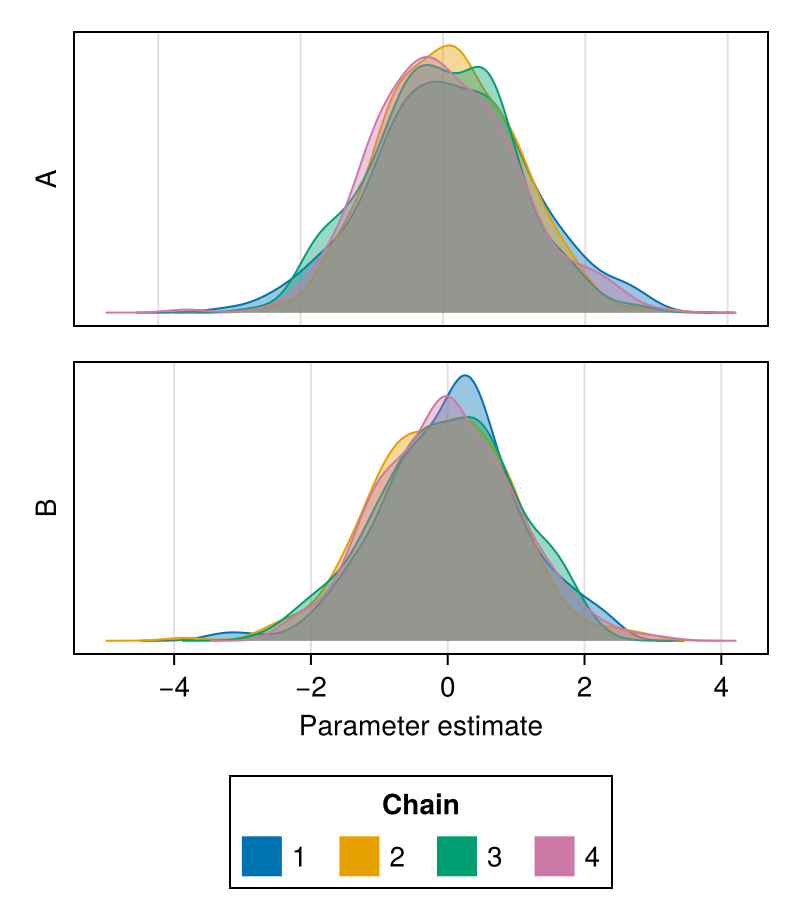
Attributes
color
Controls which colors will be used to color the density plot for each chain.
Defaults to Makie's wong_colors palette and automatically switches to colormap = :viridis for more than seven chains.
using ChainsMakie, CairoMakie
import MCMCChains: Chains
chains = Chains(randn(300, 2, 4), [:A, :B])
fig = density(chains; color = first(Makie.to_colormap(:tab20), 4))
fig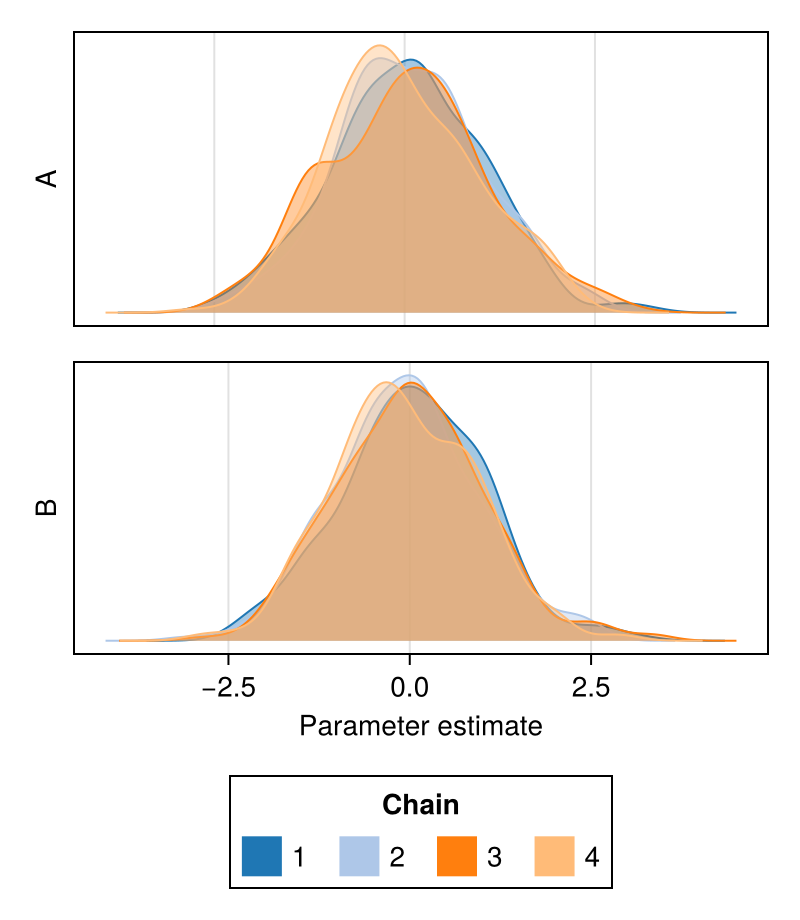
colormap
Controls which colormap will be used to color the density plot for each chain.
Defaults to the :viridis palette.
using ChainsMakie, CairoMakie
import MCMCChains: Chains
chains = Chains(randn(300, 2, 8), [:A, :B])
fig = density(chains; colormap = :plasma)
fig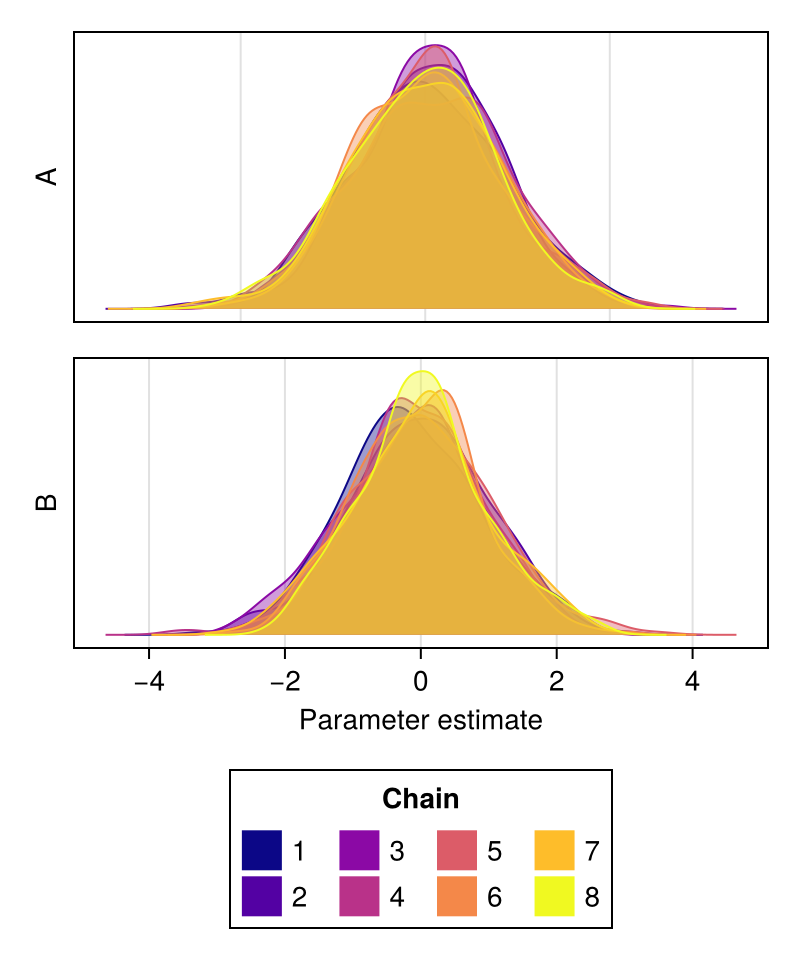
strokewidth
Controls the strokewidth of the density plot's contour.
Defaults to 1.0.
alpha
Controls the opacity of the density plot.
Defaults to 0.4.
using ChainsMakie, CairoMakie
import MCMCChains: Chains
chains = Chains(randn(300, 2, 4), [:A, :B])
fig = density(chains; strokewidth = 0.0, alpha = 0.8)
fig