ridgeline
A ridgeline plot shows the densities of the samples for each parameter in a single axis by stacking them vertically.
Similar to the forestplot, this visualization does not contain information about each individual chain. Instead, it can provide a more concise overview of parameter distributions after the computational faithfulness of MCMC sampling has been validated.
using ChainsMakie, CairoMakie
import MCMCChains: Chains
chains = Chains(randn(300, 2, 4), [:A, :B])
fig, ax, plt = ridgeline(chains)
fig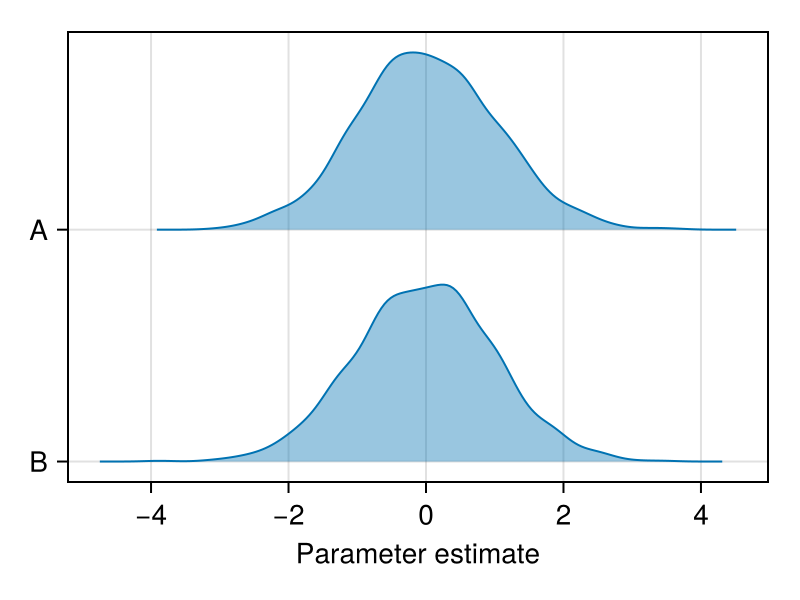
It is possible to plot a subset of the parameters by passing their names as the second argument:
using ChainsMakie, CairoMakie
import MCMCChains: Chains
chains = Chains(randn(300, 3, 4), [:A, :B, :C])
ridgeline(chains, [:A, :B])
(Scene(1 children, 0 plots), Axis (1 plots), Plot{ChainsMakie.ridgeline, Tuple{Vector{Base.ReshapedArray{Float64, 1, AxisArrays.AxisMatrix{Float64, Matrix{Float64}, Tuple{AxisArrays.Axis{:iter, StepRange{Int64, Int64}}, AxisArrays.Axis{:chain, UnitRange{Int64}}}}, Tuple{}}}}})Attributes
color
Controls the color of each density plot.
Defaults to the first color in Makie's wong_colors palette.
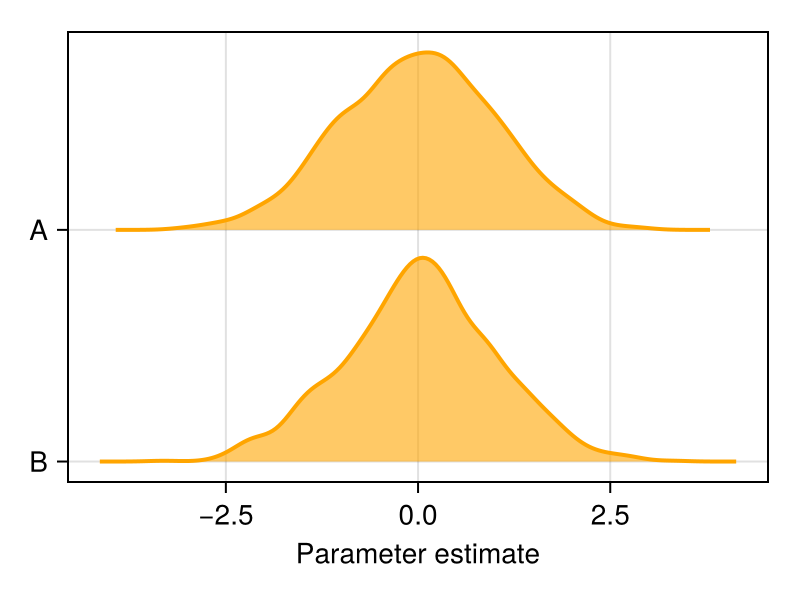
using ChainsMakie, CairoMakie
import MCMCChains: Chains
chains = Chains(randn(300, 2, 4), [:A, :B])
fig, ax, plt = ridgeline(chains; color = :orange)
fig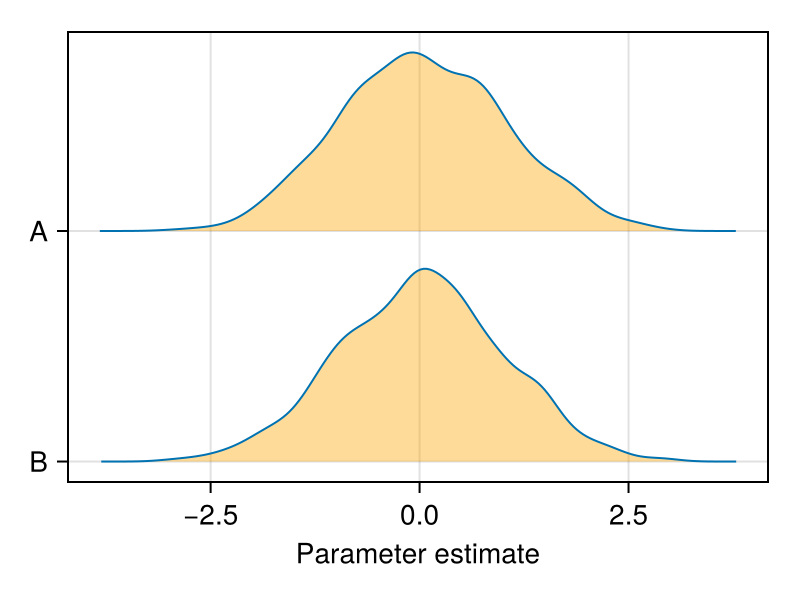
strokewidth
Controls the strokewidth of the density plot's contour.
Defaults to 1.0.
using ChainsMakie, CairoMakie
import MCMCChains: Chains
chains = Chains(randn(300, 2, 4), [:A, :B])
fig, ax, plt = ridgeline(chains; strokewidth = 2.0)
fig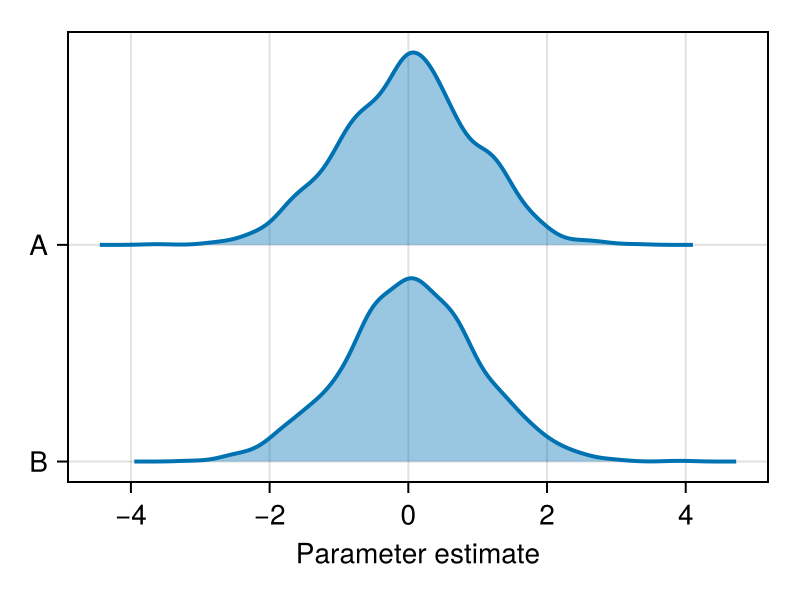
strokecolor
Controls the strokecolor of the contour around each density plot.
Defaults to the first color in Makie's wong_colors palette.
using ChainsMakie, CairoMakie
import MCMCChains: Chains
chains = Chains(randn(300, 2, 4), [:A, :B])
fig, ax, plt = ridgeline(chains; strokecolor = :black)
fig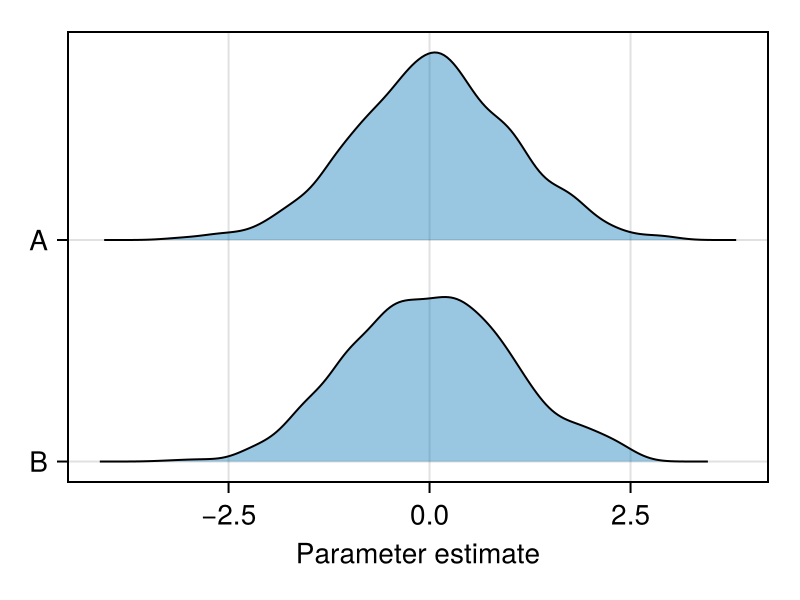
alpha
Controls the opacity of each density plot.
Defaults to 0.4.
using ChainsMakie, CairoMakie
import MCMCChains: Chains
chains = Chains(randn(300, 2, 4), [:A, :B])
fig, ax, plt = ridgeline(chains; color = :orange,
    strokecolor = :orange, strokewidth = 2.0, alpha = 0.6)
fig