trankplot
A trankplot shows the mean rank of samples per iteration bin for each chain and parameter connected by stairs.
Trankplots are an alternative for traceplots which perform well at reveal convergence issues irrespective of the number of iterations per chain.
using ChainsMakie, CairoMakie
import MCMCChains: Chains
chains = Chains(randn(300, 2, 4), [:A, :B])
fig = trankplot(chains)
fig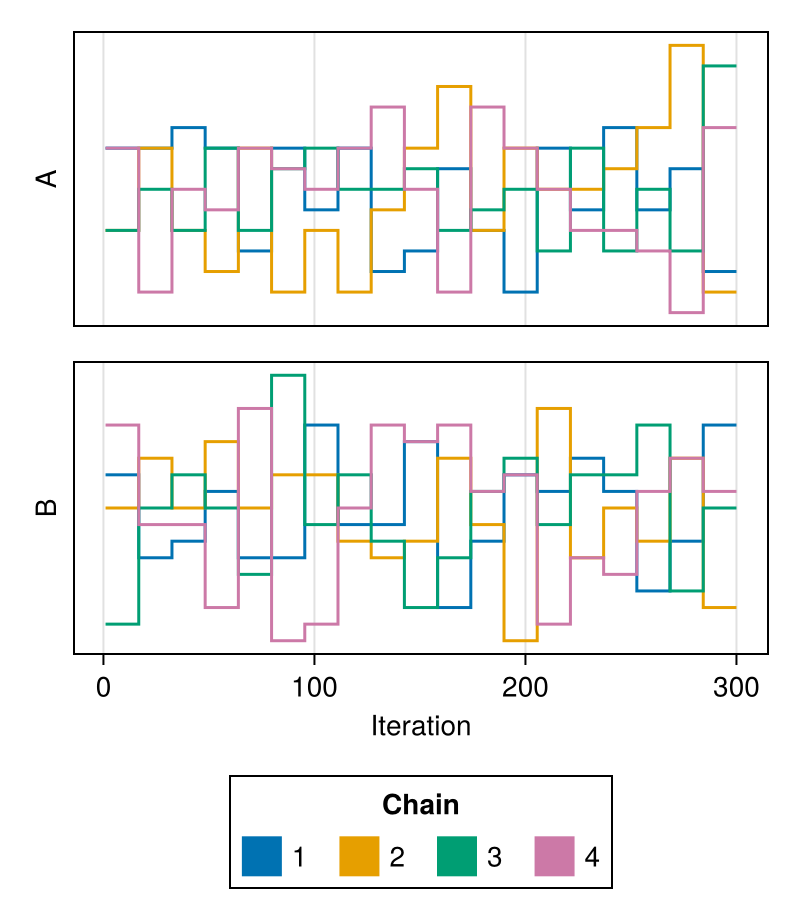
It is possible to plot a subset of the parameters by passing their names as the second argument:
using ChainsMakie, CairoMakie
import MCMCChains: Chains
chains = Chains(randn(300, 3, 4), [:A, :B, :C])
trankplot(chains, [:A, :B])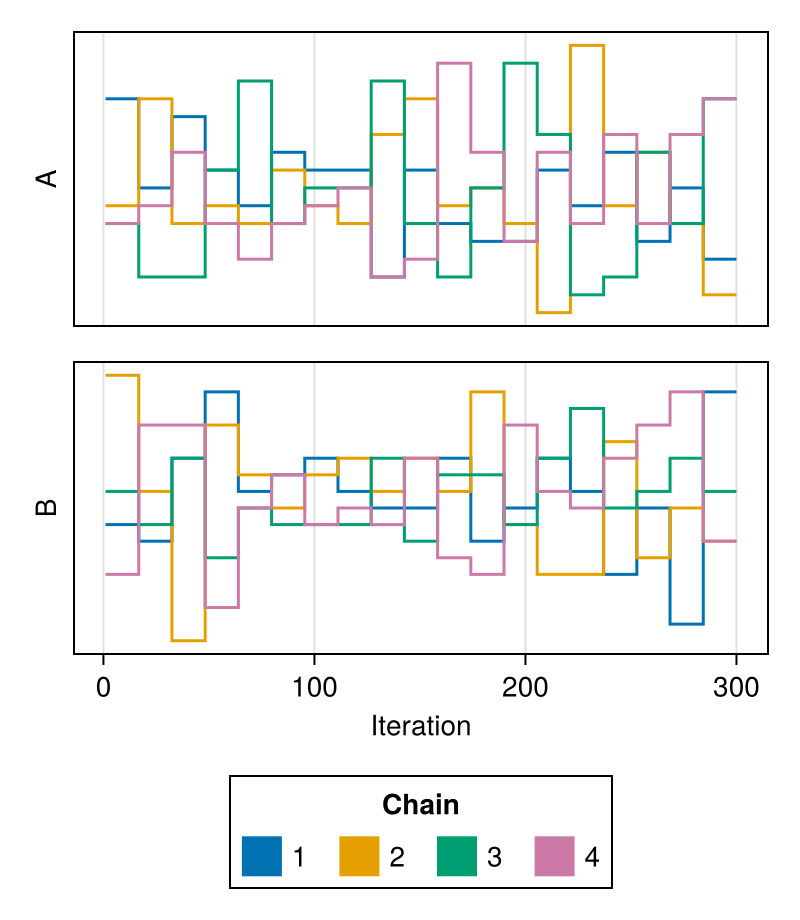
Attributes
color
Specifies the colors to be used for coloring the rank trace of each chain.
Defaults to Makie's wong_colors palette and automatically switches to colormap = :viridis for more than seven chains.
using ChainsMakie, CairoMakie
import MCMCChains: Chains
chains = Chains(randn(300, 2, 4), [:A, :B])
fig = trankplot(chains; color = first(Makie.to_colormap(:tab20), 4))
fig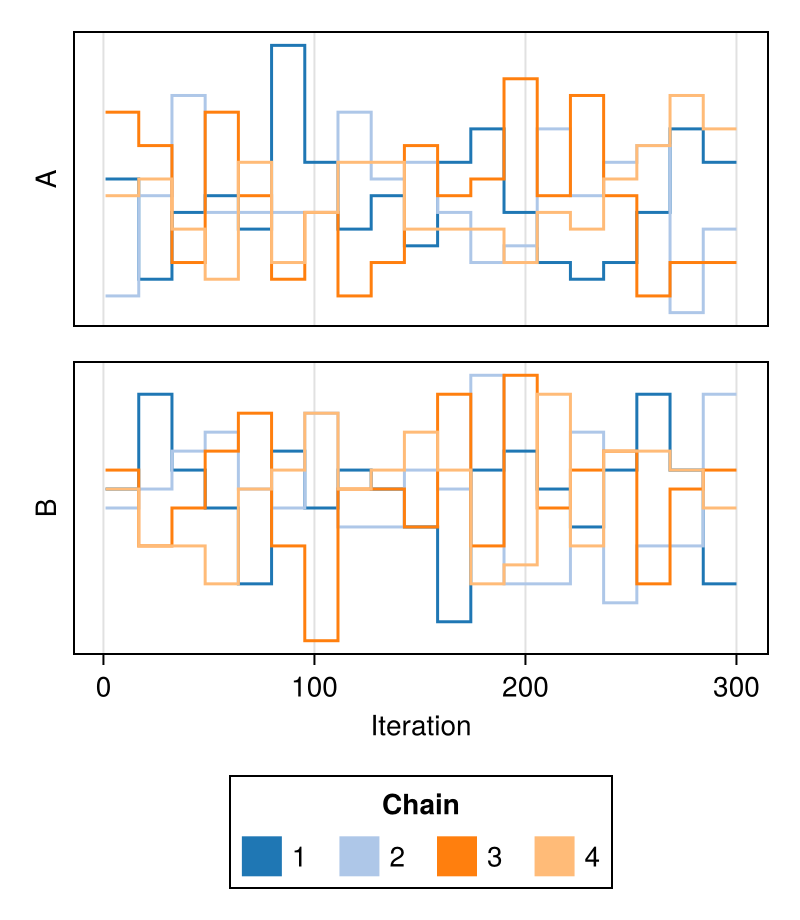
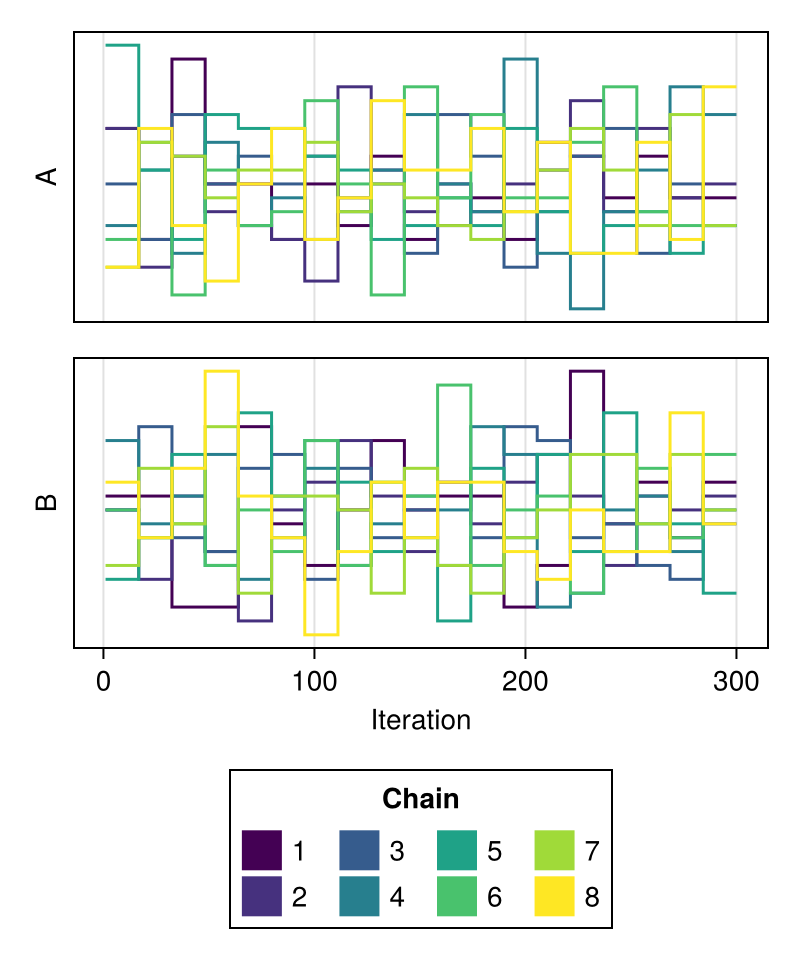
colormap
Specifies the colormap to be used for coloring the rank trace of each chain.
Defaults to :viridis.
using ChainsMakie, CairoMakie
import MCMCChains: Chains
chains = Chains(randn(300, 2, 8), [:A, :B])
fig = trankplot(chains; colormap = :plasma)
fig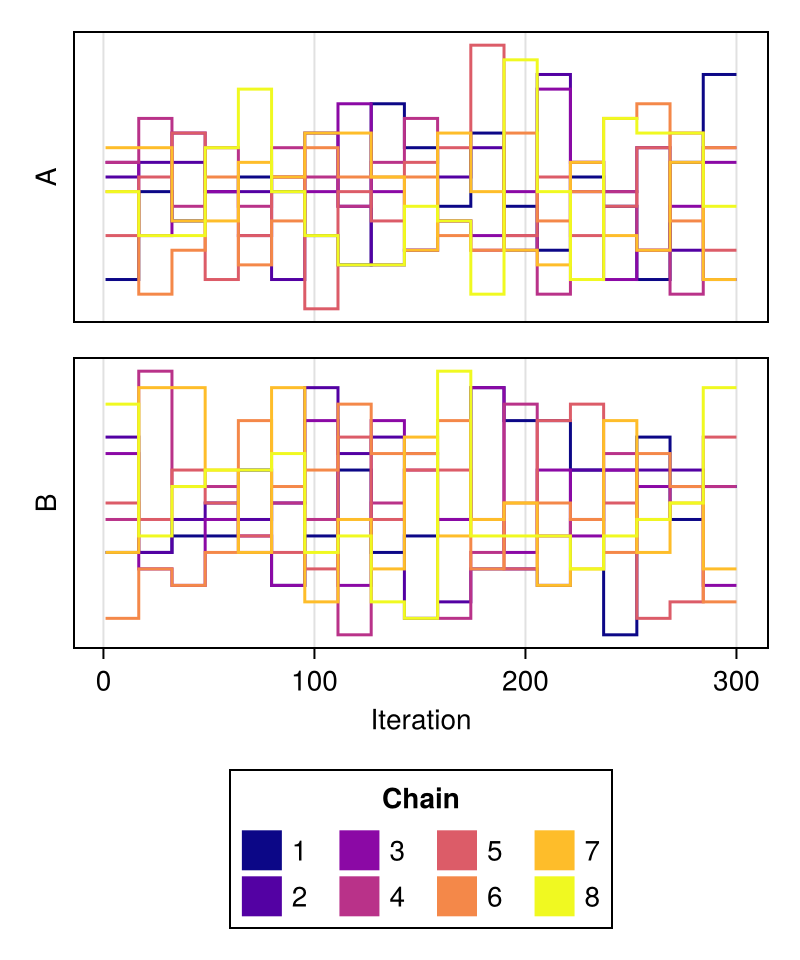
linewidth
Controls the linewidth of each rank trace.
Defaults to 1.5.
alpha
Controls the opacity of each rank trace.
Defaults to 0.8.
using ChainsMakie, CairoMakie
import MCMCChains: Chains
chains = Chains(randn(300, 2, 8), [:A, :B])
fig = trankplot(chains; linewidth = 1.0, alpha = 1.0)
fig