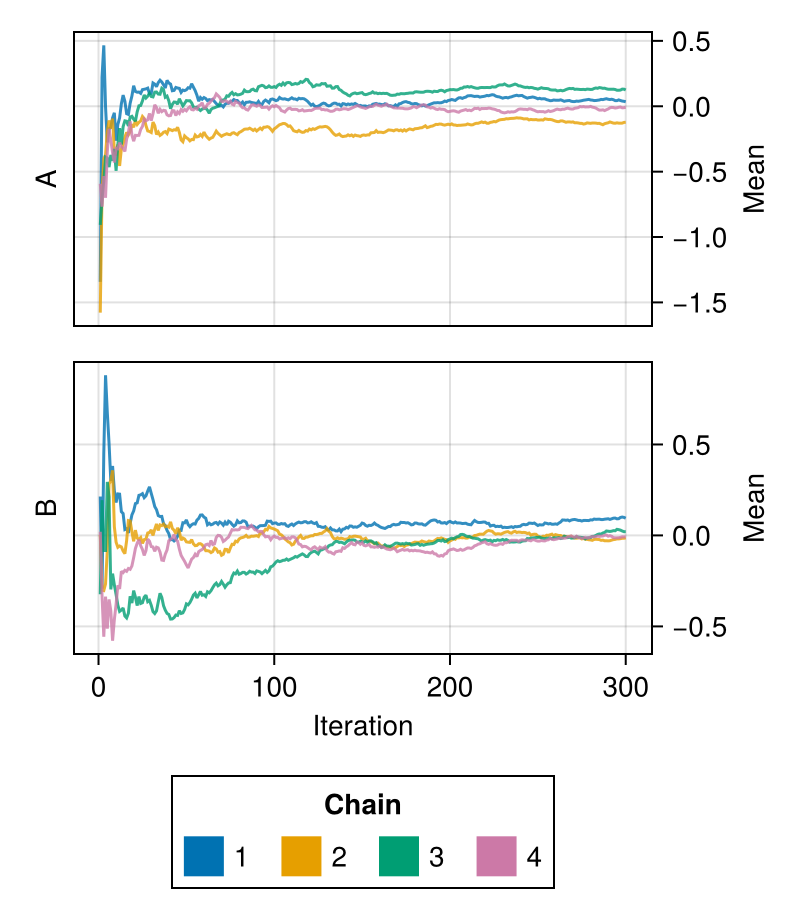
meanplot
A meanplot shows the running average of the samples for each chain and parameter.
Plotting the running average shows when, if at all, each of the chains has converged to the stationary distribution around the true parameter mean.
julia
using ChainsMakie, CairoMakie
import MCMCChains: Chains
chains = Chains(randn(300, 2, 4), [:A, :B])
fig = meanplot(chains)
fig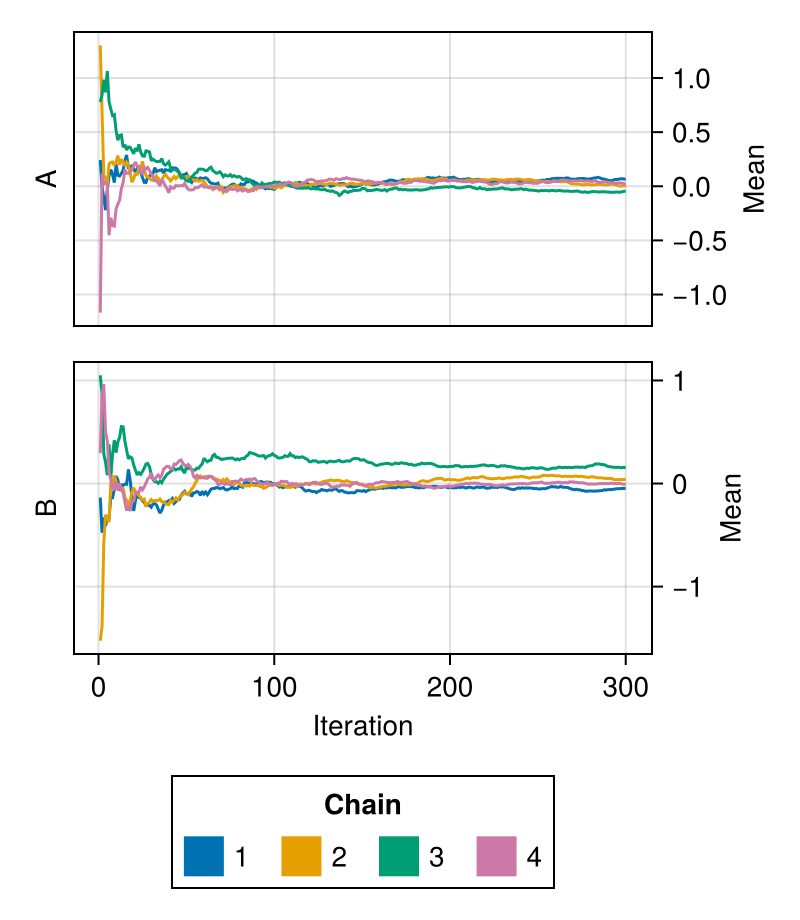
It is possible to plot a subset of the parameters by passing their names as the second argument:
julia
using ChainsMakie, CairoMakie
import MCMCChains: Chains
chains = Chains(randn(300, 3, 4), [:A, :B, :C])
meanplot(chains, [:A, :B])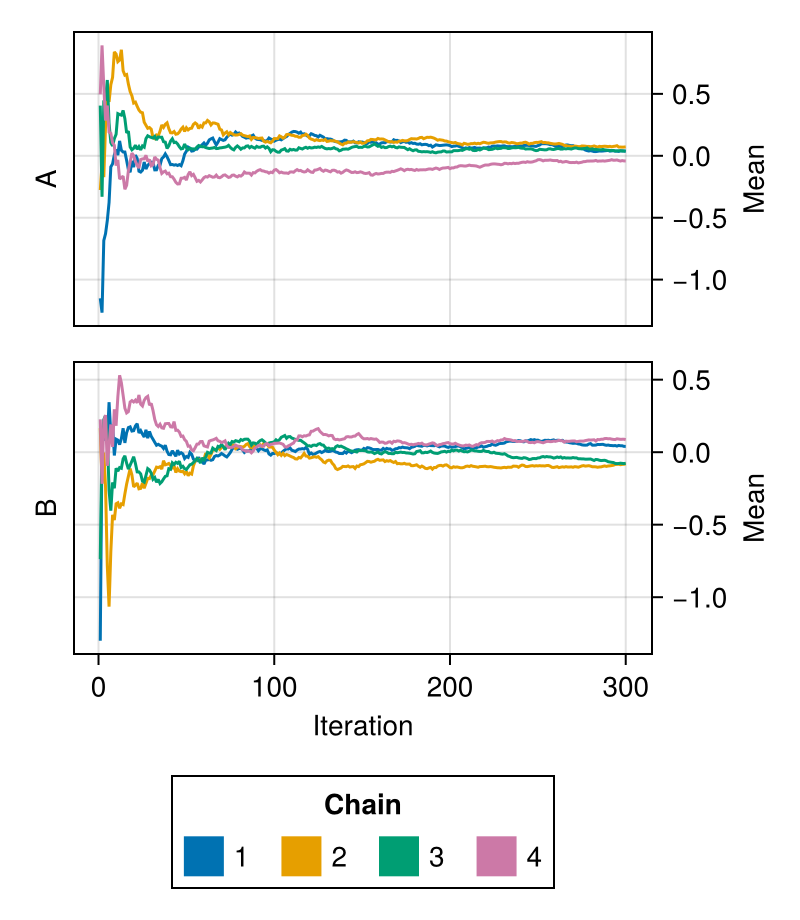
Attributes
color
Specifies the colors to be used for coloring the running average of each chain.
Defaults to Makie's wong_colors palette and automatically switches to colormap = :viridis for more than seven chains.
julia
using ChainsMakie, CairoMakie
import MCMCChains: Chains
chains = Chains(randn(300, 2, 4), [:A, :B])
fig = meanplot(chains; color = first(Makie.to_colormap(:tab20), 4))
fig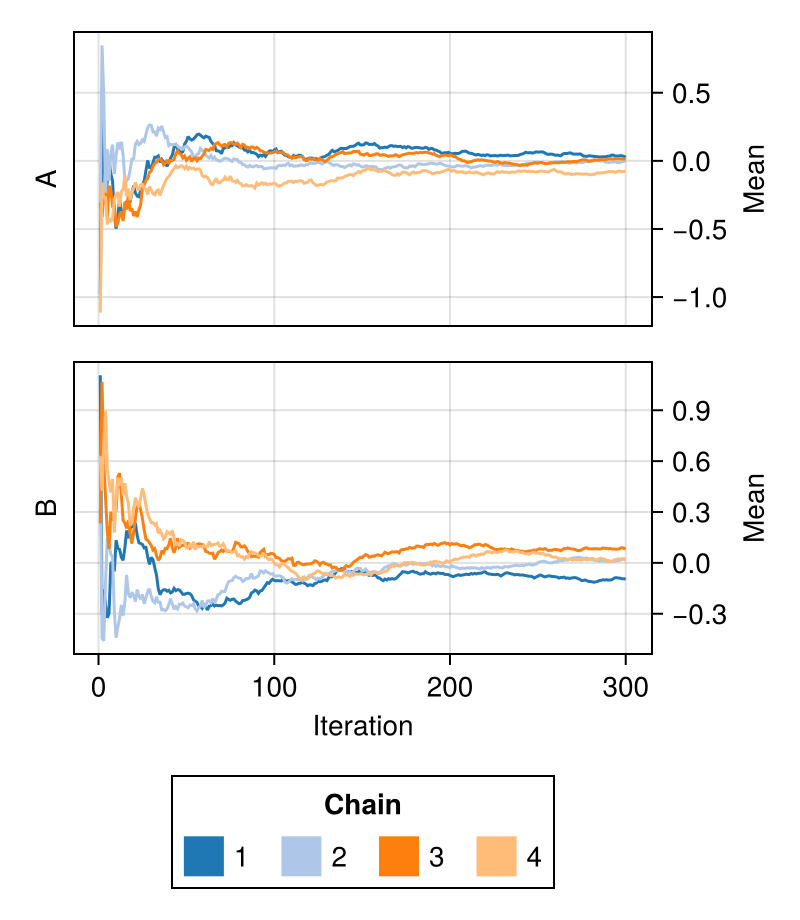
colormap
Specifies the colormap to be used for coloring the running average of each chain.
Defaults to :viridis.
julia
using ChainsMakie, CairoMakie
import MCMCChains: Chains
chains = Chains(randn(300, 2, 8), [:A, :B])
fig = meanplot(chains; colormap = :plasma)
fig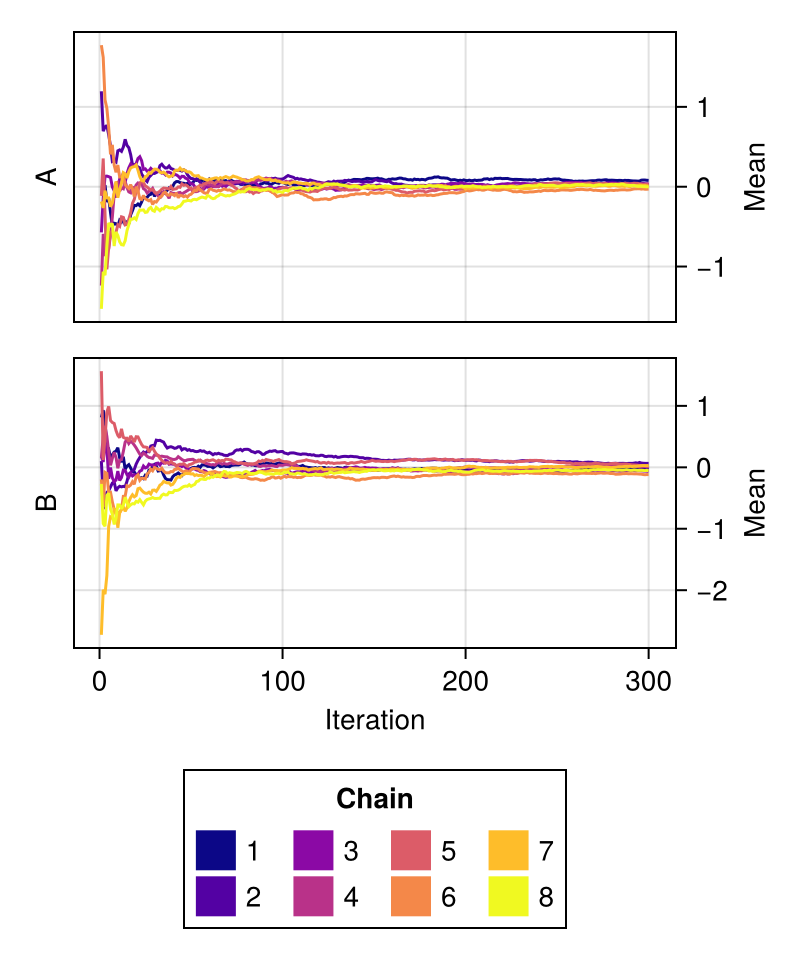
linewidth
Controls the linewidth of each line.
alpha
Controls the opacity of each line.
julia
using ChainsMakie, CairoMakie
import MCMCChains: Chains
chains = Chains(randn(300, 2, 4), [:A, :B])
fig = meanplot(chains; linewidth = 0.0, alpha = 0.8)
fig