hist
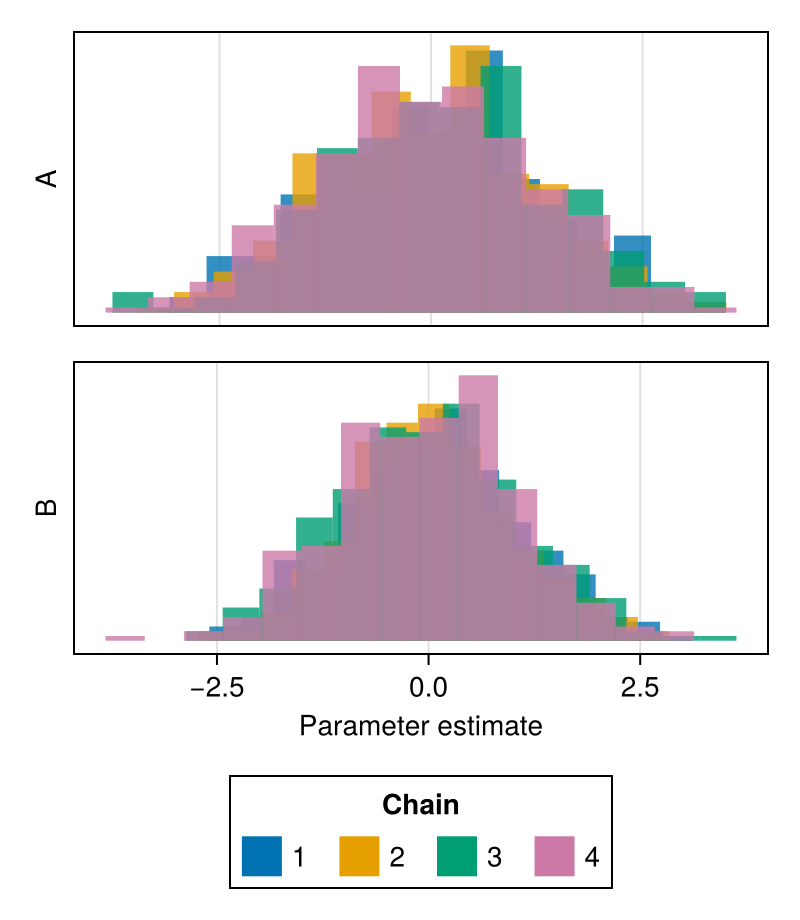
Plotting a histogram of Chains creates a histogram for the samples in each chain.
Its role in evaluating MCMC samples is similar to that of density.
julia
using ChainsMakie, CairoMakie
import MCMCChains: Chains
chains = Chains(randn(300, 2, 4), [:A, :B])
fig = hist(chains)
fig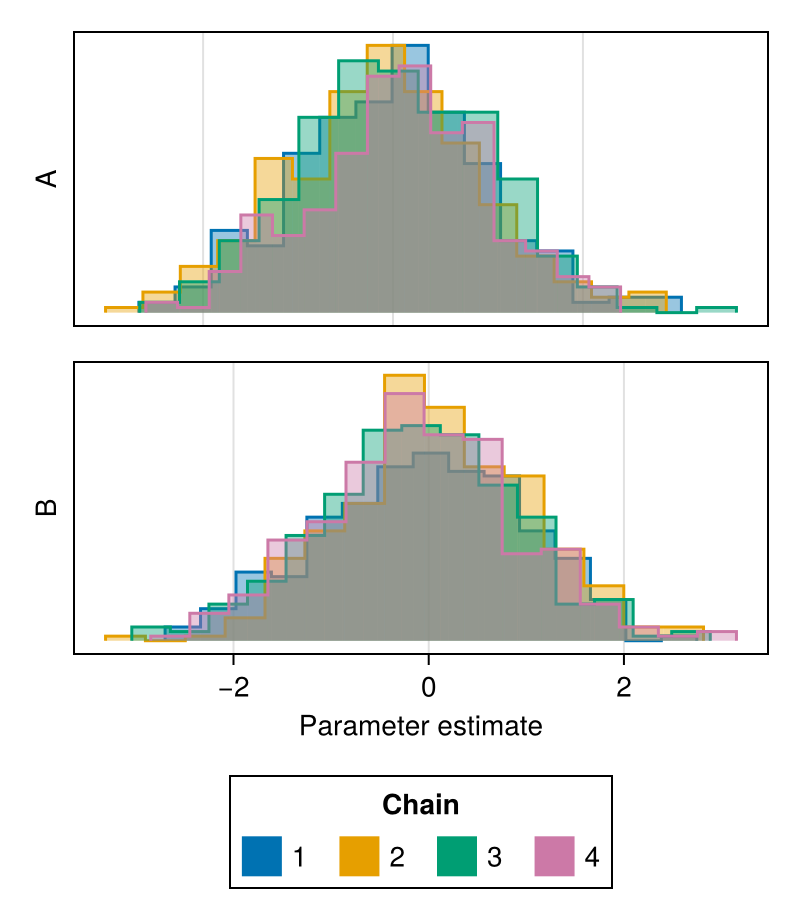
It is possible to plot a subset of the parameters by passing their names as the second argument:
julia
using ChainsMakie, CairoMakie
import MCMCChains: Chains
chains = Chains(randn(300, 3, 4), [:A, :B, :C])
hist(chains, [:A, :B])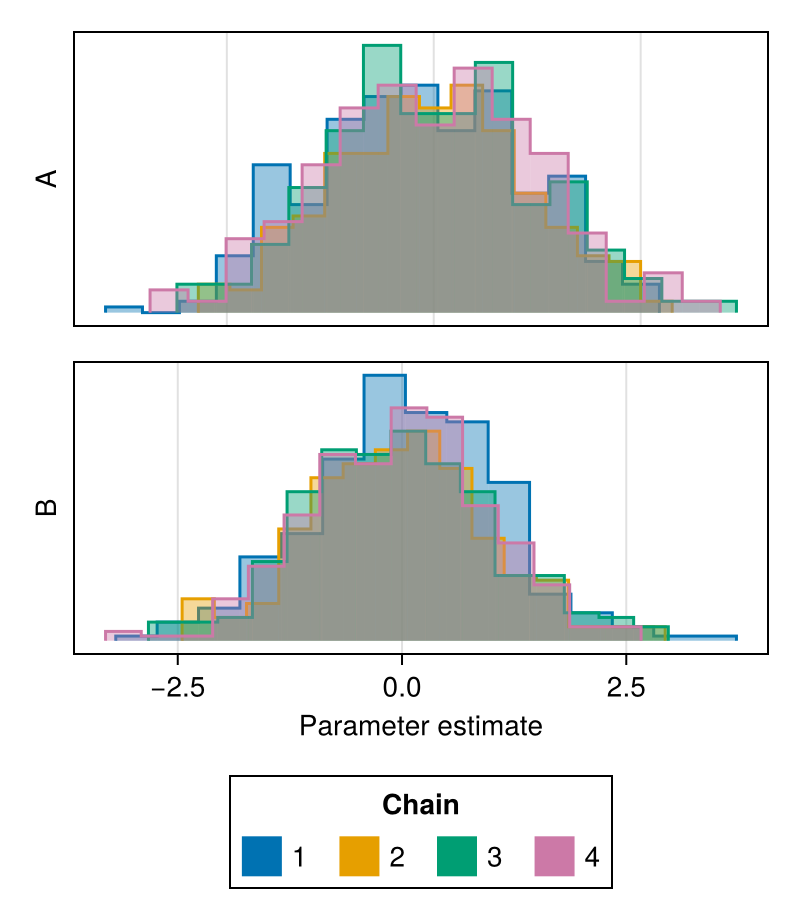
Attributes
color
Specifies the colors to be used for coloring the histogram of each chain.
Defaults to Makie's wong_colors palette and automatically switches to colormap = :viridis for more than seven chains.
julia
using ChainsMakie, CairoMakie
import MCMCChains: Chains
chains = Chains(randn(300, 2, 4), [:A, :B])
fig = hist(chains; color = first(Makie.to_colormap(:tab20), 4))
fig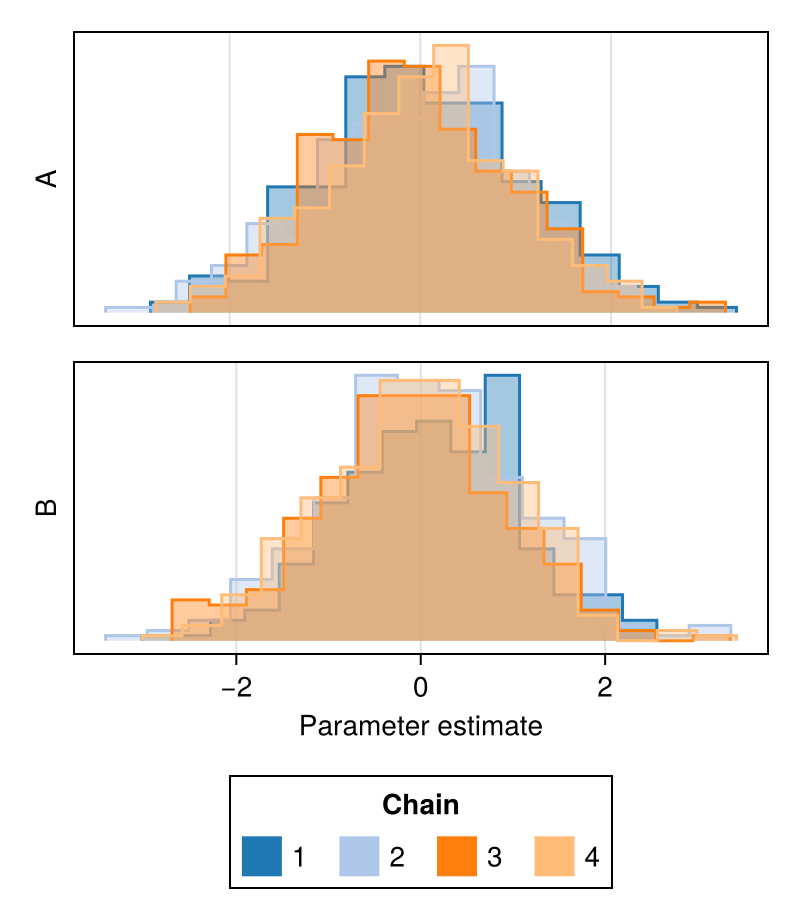
colormap
Specifies the colormap to be used for coloring the histogram of each chain.
Defaults to :viridis.
julia
using ChainsMakie, CairoMakie
import MCMCChains: Chains
chains = Chains(randn(300, 2, 8), [:A, :B])
fig = hist(chains; colormap = :plasma)
fig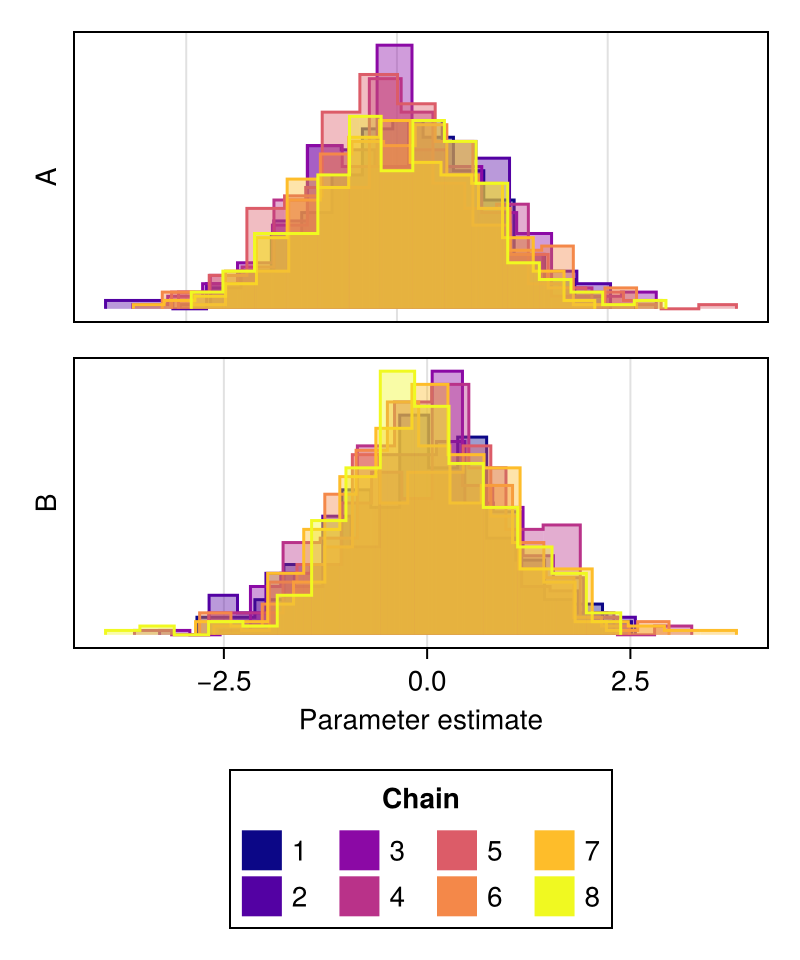
bins
Controls the number of bins used for each histogram.
julia
using ChainsMakie, CairoMakie
import MCMCChains: Chains
chains = Chains(randn(300, 2, 4), [:A, :B])
fig = hist(chains; bins = 30)
fig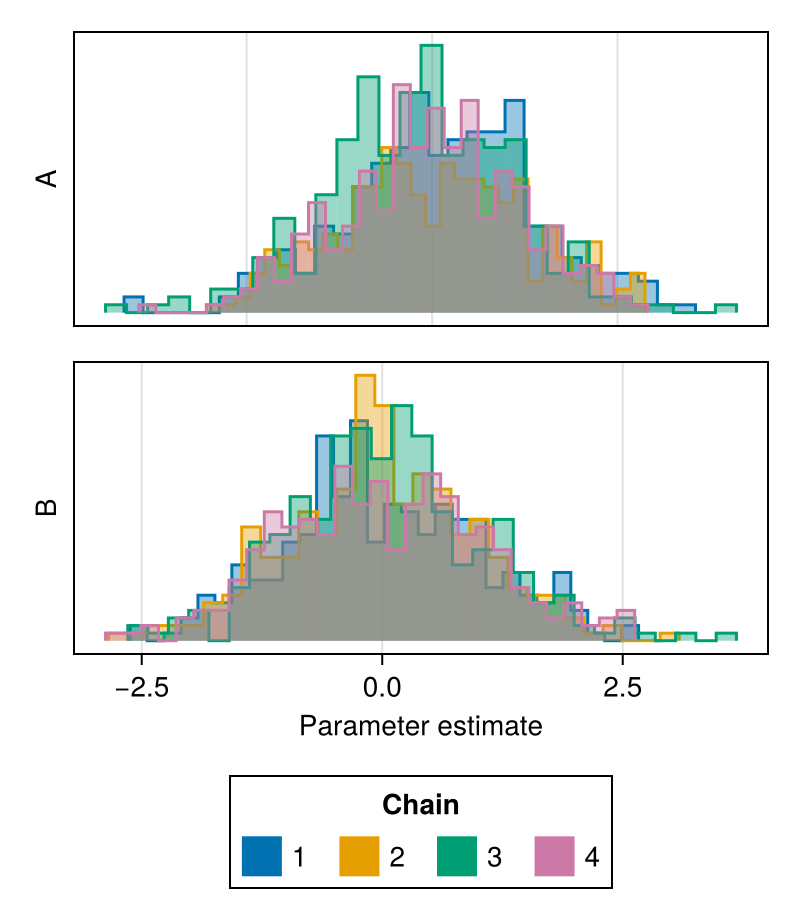
linewidth
Controls the linewidth of the contour around each histogram.
alpha
Controls the opacity of each histogram.
julia
using ChainsMakie, CairoMakie
import MCMCChains: Chains
chains = Chains(randn(300, 2, 4), [:A, :B])
fig = hist(chains; linewidth = 0.0, alpha = 0.8)
fig