traceplot
A traceplot shows the sampled values per iteration for each chain and parameter connected by a line.
Traceplots are typically the default choice to inspect whether chains have converged to the same stationary distribution. Traceplots indicate faithful computation if the sampled values for each chain jump around randomly around the same mean, with no chain consistently sampling higher or lower values than the others. The shape resulting from this behavior is sometimes described as "the hairy caterpillar".
A limitation of traceplots emerges as the number of iterations per chain increases and, consequently, the resolution on the horizontal axis begins to degrade. One way to resolve this issue is by plotting binned ranks of the samples instead, as implemented in trankplot.
using ChainsMakie, CairoMakie
import MCMCChains: Chains
chains = Chains(randn(300, 2, 4), [:A, :B])
fig = traceplot(chains)
fig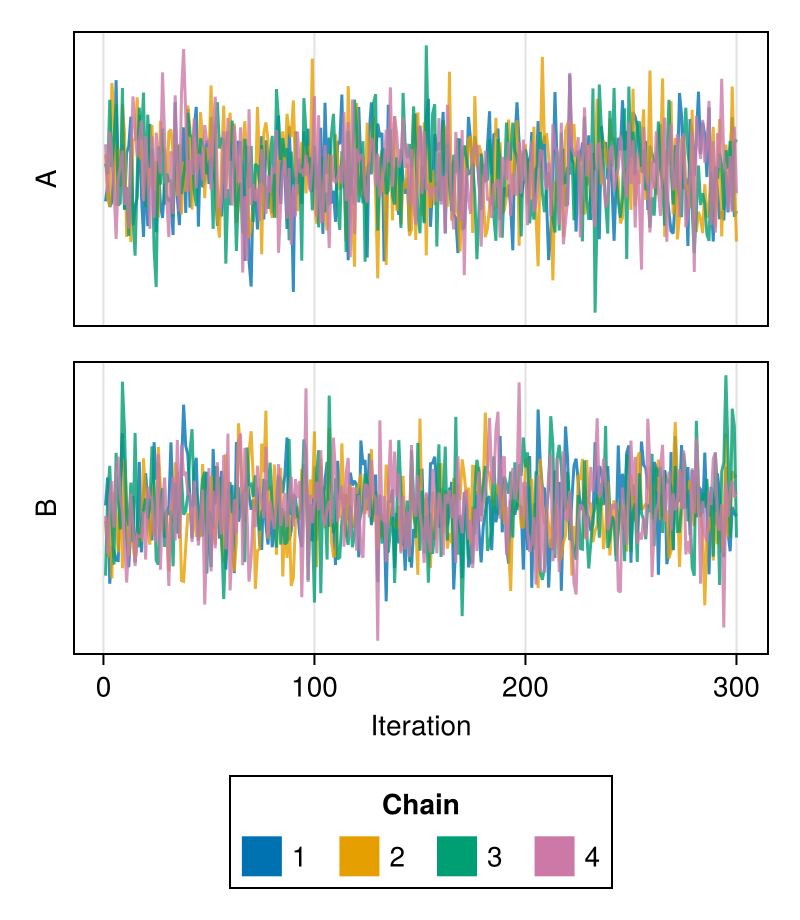
It is possible to plot a subset of the parameters by passing their names as the second argument:
using ChainsMakie, CairoMakie
import MCMCChains: Chains
chains = Chains(randn(300, 3, 4), [:A, :B, :C])
traceplot(chains, [:A, :B])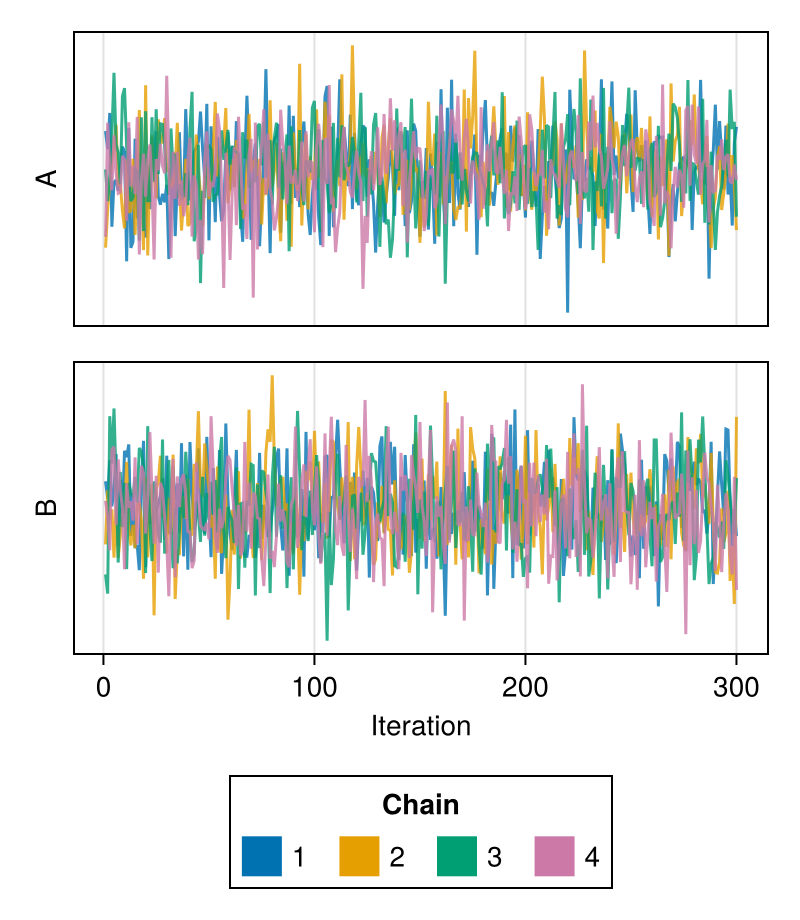
Attributes
color
Specifies the colors to be used for coloring the traceplot of each chain.
Defaults to Makie's wong_colors palette and automatically switches to colormap = :viridis for more than seven chains.
using ChainsMakie, CairoMakie
import MCMCChains: Chains
chains = Chains(randn(300, 2, 4), [:A, :B])
fig = traceplot(chains; color = first(Makie.to_colormap(:tab20), 4))
fig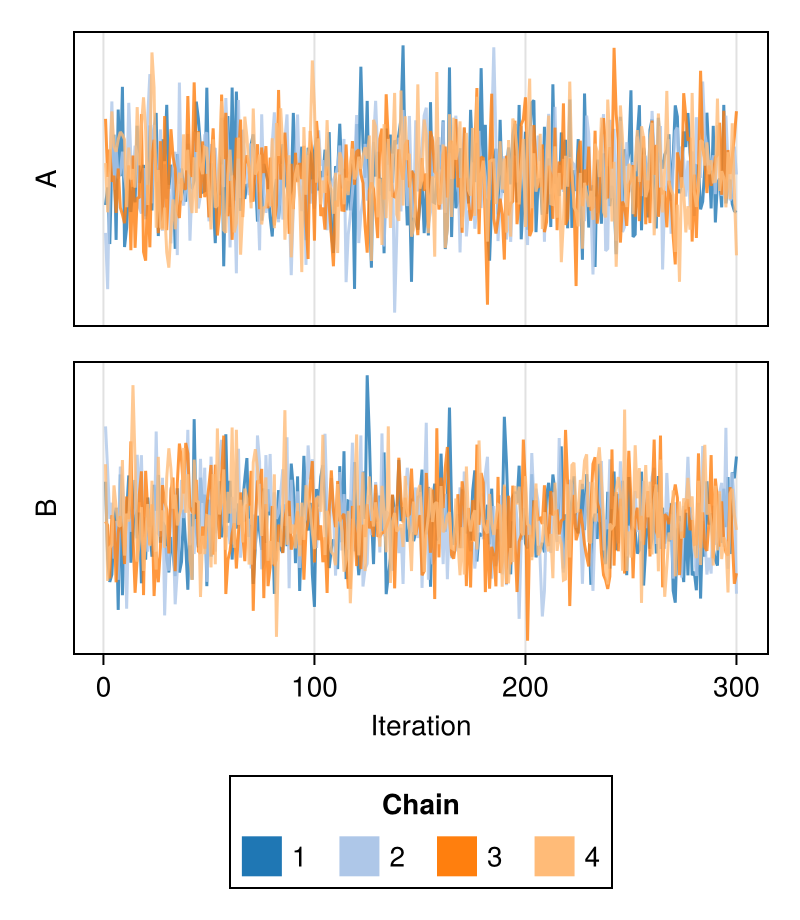
colormap
Specifies the colormap to be used for coloring the traceplot of each chain.
Defaults to :viridis.
using ChainsMakie, CairoMakie
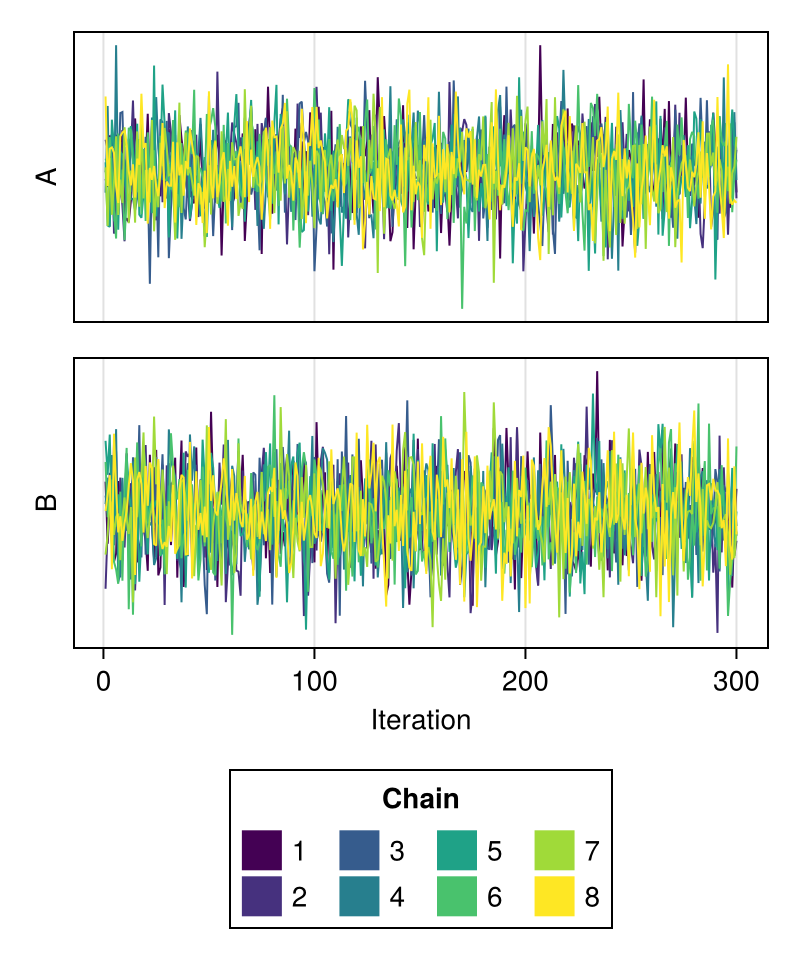
import MCMCChains: Chains
chains = Chains(randn(300, 2, 8), [:A, :B])
fig = traceplot(chains; colormap = :plasma)
fig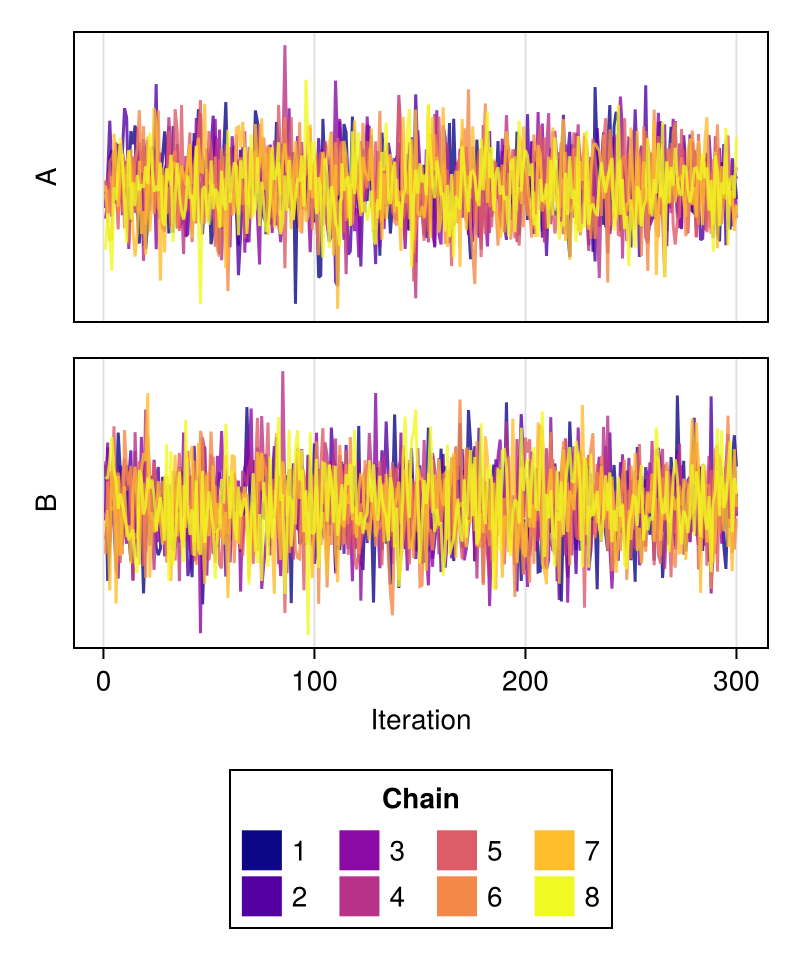
linewidth
Controls the linewidth of each trace.
Defaults to 1.5.
alpha
Controls the opacity of each trace.
Defaults to 0.8.
using ChainsMakie, CairoMakie
import MCMCChains: Chains
chains = Chains(randn(300, 2, 8), [:A, :B])
fig = traceplot(chains; linewidth = 1.0, alpha = 1.0)
fig